Citibank 2008 Annual Report Download - page 71
Download and view the complete annual report
Please find page 71 of the 2008 Citibank annual report below. You can navigate through the pages in the report by either clicking on the pages listed below, or by using the keyword search tool below to find specific information within the annual report.-
 1
1 -
2
-
3
-
4
-
5
-
6
-
7
-
8
-
9
-
10
-
11
-
12
-
13
-
14
-
15
-
16
-
17
-
18
-
19
-
20
-
21
-
22
-
23
-
24
-
25
-
26
-
27
-
28
-
29
-
30
-
31
-
32
-
33
-
34
-
35
-
36
-
37
-
38
-
39
-
40
-
41
-
42
-
43
-
44
-
45
-
46
-
47
-
48
-
49
-
50
-
51
-
52
-
53
-
54
-
55
-
56
-
57
-
58
-
59
-
60
-
 61
61 -
 62
62 -
 63
63 -
 64
64 -
 65
65 -
 66
66 -
 67
67 -
 68
68 -
 69
69 -
 70
70 -
 71
71 -
 72
72 -
 73
73 -
 74
74 -
 75
75 -
 76
76 -
 77
77 -
 78
78 -
 79
79 -
 80
80 -
 81
81 -
82
-
83
-
84
-
85
-
86
-
87
-
88
-
89
-
90
-
91
-
92
-
93
-
94
-
95
-
96
-
97
-
98
-
99
-
100
-
101
-
102
-
103
-
104
-
105
-
106
-
107
-
108
-
109
-
110
-
111
-
112
-
113
-
114
-
115
-
116
-
117
-
118
-
119
-
120
-
121
-
122
-
123
-
124
-
125
-
126
-
127
-
128
-
129
-
130
-
131
-
132
-
133
-
134
-
135
-
136
-
137
-
138
-
139
-
140
-
141
-
142
-
143
-
144
-
145
-
146
-
147
-
148
-
149
-
150
-
151
-
152
-
153
-
154
-
155
-
156
-
157
-
158
-
159
-
160
-
161
-
162
-
163
-
164
-
165
-
166
-
167
-
168
-
169
-
170
-
171
-
172
-
173
-
174
-
175
-
176
-
177
-
178
-
179
-
180
-
181
-
182
-
183
-
184
-
185
-
186
-
187
-
188
-
189
-
190
-
191
-
192
-
193
-
194
-
195
-
196
-
197
-
198
-
199
-
200
-
201
-
202
-
203
-
204
-
205
-
206
-
207
-
208
-
209
-
210
-
211
-
212
-
213
-
214
-
215
-
216
-
217
-
218
-
219
-
220
-
221
-
222
-
223
-
224
-
225
-
226
-
227
-
228
-
229
-
230
-
231
-
232
-
233
-
234
-
235
-
236
-
237
-
238
-
239
-
240
-
241
-
242
-
243
-
244
-
245
-
246
-
247
-
248
-
249
-
250
-
251
-
252
 |
 |

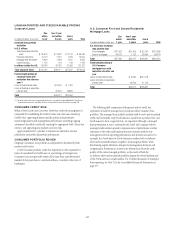
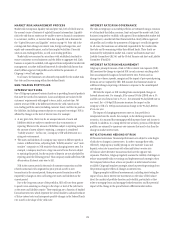
CORPORATE CREDIT RISK
For corporate clients and investment banking activities across Citigroup, the
credit process is grounded in a series of fundamental policies, including:
• joint business and independent risk management responsibility for
managing credit risks;
• a single center of control for each credit relationship that coordinates
credit activities with that client;
• portfolio limits to ensure diversification and maintain risk/capital
alignment;
• a minimum of two authorized-credit-officer signatures required on
extensions of credit, one of which must be from a credit officer in credit
risk management;
• risk rating standards, applicable to every obligor and facility; and
• consistent standards for credit origination documentation and remedial
management.
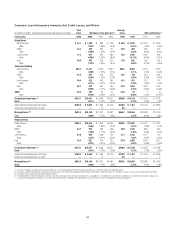
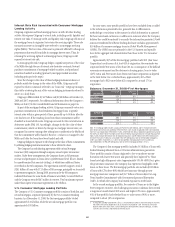
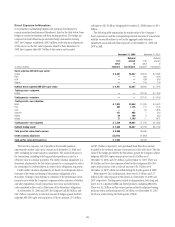
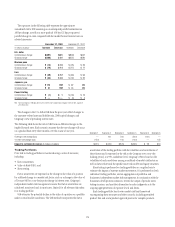
The following table represents the corporate credit portfolio, before
consideration of collateral, by maturity at December 31, 2008. The corporate
portfolio is broken out by direct outstandings which include drawn loans,
overdrafts, interbank placements, bankers’ acceptances, certain investment
securities and leases and unfunded commitments which include unused
commitments to lend, letters of credit and financial guarantees.
Corporate Credit Portfolio
At December 31, 2008
In billions of dollars
Due
within
1 year
Greater
than 1 year
but within
5 years
Greater
than
5 years
Total
exposure
Direct outstandings $161 $100 $ 9 $270
Unfunded lending commitments 206 141 12 359
Total $367 $241 $21 $629
At December 31, 2007
In billions of dollars
Due
within
1 year
Greater
than 1 year
but within
5 years
Greater
than
5 years
Total
exposure
Direct outstandings $190 $ 97 $12 $299
Unfunded lending commitments 277 183 11 471
Total $467 $280 $23 $770
Portfolio Mix
The corporate credit portfolio is diverse across counterparty, industry and
geography. The following table shows direct outstandings and unfunded
commitments by region:
December 31,
2008
December 31,
2007
North America 48% 48%
Asia 13 14
Latin America 88
EMEA 31 30
Total 100% 100%
The maintenance of accurate and consistent risk ratings across the
corporate credit portfolio facilitates the comparison of credit exposure across
all lines of business, geographic regions and products.
Obligor risk ratings reflect an estimated probability of default for an
obligor and are derived primarily through the use of statistical models
(which are validated periodically), external rating agencies (under defined
circumstances) or approved scoring methodologies. Facility risk ratings are
assigned, using the obligor risk rating, and then factors that affect the loss-
given default of the facility, such as support or collateral, are taken into
account.
Internal obligor ratings equivalent to BBB and above are considered
investment grade. Ratings below the equivalent of the BBB category are
considered non-investment grade.
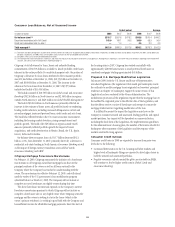
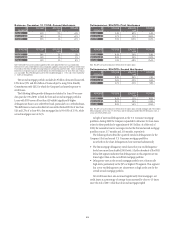
The following table presents the corporate credit portfolio by facility risk
rating at December 31, 2008 and 2007, as a percentage of the total portfolio:
Direct outstandings and
unfunded commitments
2008 2007
AAA/AA/A 57% 53%
BBB 24 24
BB/B 13 20
CCC or below 62
Unrated —1
Total 100% 100%
The corporate credit portfolio is diversified by industry, with a
concentration only in the financial sector, including banks, other financial
institutions, insurance companies, investment banks and government and
central banks. The following table shows the allocation of direct
outstandings and unfunded commitments to industries as a percentage of
the total corporate portfolio:
Direct outstandings and
unfunded commitments
2008 2007
Government and central banks 12% 8%
Investment banks 78
Banks 77
Other financial institutions 54
Utilities 54
Insurance 44
Petroleum 44
Agriculture and food preparation 44
Telephone and cable 36
Industrial machinery and equipment 33
Global information technology 33
Chemicals 33
Autos 22
Metals 23
Other industries (1) 36 37
Total 100% 100%
(1) Includes all other industries, none of which exceeds 2% of total outstandings.
65