Citibank 2008 Annual Report Download - page 90
Download and view the complete annual report
Please find page 90 of the 2008 Citibank annual report below. You can navigate through the pages in the report by either clicking on the pages listed below, or by using the keyword search tool below to find specific information within the annual report.-
 1
1 -
2
-
3
-
4
-
5
-
6
-
7
-
8
-
9
-
10
-
11
-
12
-
13
-
14
-
15
-
16
-
17
-
18
-
19
-
20
-
21
-
22
-
23
-
24
-
25
-
26
-
27
-
28
-
29
-
30
-
31
-
32
-
33
-
34
-
35
-
36
-
37
-
38
-
39
-
40
-
41
-
42
-
43
-
44
-
45
-
46
-
47
-
48
-
49
-
50
-
51
-
52
-
53
-
54
-
55
-
56
-
57
-
58
-
59
-
60
-
61
-
62
-
63
-
64
-
65
-
66
-
67
-
68
-
69
-
70
-
71
-
72
-
73
-
74
-
75
-
76
-
77
-
78
-
79
-
 80
80 -
 81
81 -
 82
82 -
 83
83 -
 84
84 -
 85
85 -
 86
86 -
 87
87 -
 88
88 -
 89
89 -
 90
90 -
 91
91 -
 92
92 -
 93
93 -
 94
94 -
 95
95 -
 96
96 -
 97
97 -
 98
98 -
 99
99 -
 100
100 -
101
-
102
-
103
-
104
-
105
-
106
-
107
-
108
-
109
-
110
-
111
-
112
-
113
-
114
-
115
-
116
-
117
-
118
-
119
-
120
-
121
-
122
-
123
-
124
-
125
-
126
-
127
-
128
-
129
-
130
-
131
-
132
-
133
-
134
-
135
-
136
-
137
-
138
-
139
-
140
-
141
-
142
-
143
-
144
-
145
-
146
-
147
-
148
-
149
-
150
-
151
-
152
-
153
-
154
-
155
-
156
-
157
-
158
-
159
-
160
-
161
-
162
-
163
-
164
-
165
-
166
-
167
-
168
-
169
-
170
-
171
-
172
-
173
-
174
-
175
-
176
-
177
-
178
-
179
-
180
-
181
-
182
-
183
-
184
-
185
-
186
-
187
-
188
-
189
-
190
-
191
-
192
-
193
-
194
-
195
-
196
-
197
-
198
-
199
-
200
-
201
-
202
-
203
-
204
-
205
-
206
-
207
-
208
-
209
-
210
-
211
-
212
-
213
-
214
-
215
-
216
-
217
-
218
-
219
-
220
-
221
-
222
-
223
-
224
-
225
-
226
-
227
-
228
-
229
-
230
-
231
-
232
-
233
-
234
-
235
-
236
-
237
-
238
-
239
-
240
-
241
-
242
-
243
-
244
-
245
-
246
-
247
-
248
-
249
-
250
-
251
-
252
 |
 |

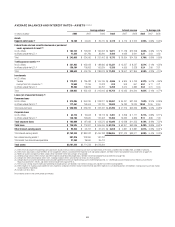
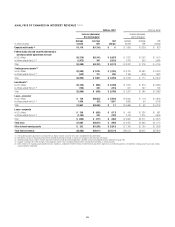
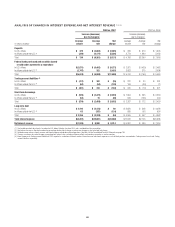
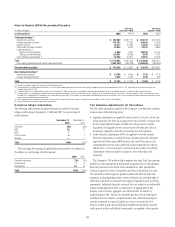
AVERAGE BALANCES AND INTEREST RATES—LIABILITIES AND EQUITY,
AND NET INTEREST REVENUE (1)(2)(3)(4)
Average volume Interest expense % Average rate
In millions of dollars 2008 2007 2006 2008 2007 2006 2008 2007 2006
Liabilities
Deposits
In U.S. offices
Savings deposits (5) $ 162,060 $ 149,304 $ 134,760 $ 2,921 $ 4,772 $ 4,056 1.80% 3.20% 3.01%
Other time deposits 58,998 58,808 48,558 2,604 3,358 2,471 4.41 5.71 5.09
In offices outside the U.S. (6) 473,451 481,874 389,430 14,746 20,272 14,809 3.11 4.21 3.80
Total $ 694,509 $ 689,986 $ 572,748 $20,271 $28,402 $21,336 2.92% 4.12% 3.73%
Federal funds purchased and securities loaned or sold under
agreements to repurchase (7)
In U.S. offices $ 185,621 $ 244,258 $ 194,726 $ 5,066 $14,339 $11,857 2.73% 5.87% 6.09%
In offices outside the U.S. (6) 98,846 142,370 95,937 6,264 8,689 5,591 6.34 6.10 5.83
Total $ 284,467 $ 386,628 $ 290,663 $11,330 $23,028 $17,448 3.98% 5.96% 6.00%
Trading account liabilities (8) (9)
In U.S. offices $ 31,984 $ 46,383 $ 36,983 $ 1,107 $ 1,142 $ 891 3.46% 2.46% 2.41%
In offices outside the U.S. (6) 43,991 58,228 37,802 170 298 228 0.39 0.51 0.60
Total $ 75,975 $ 104,611 $ 74,785 $ 1,277 $ 1,440 $ 1,119 1.68% 1.38% 1.50%
Short-term borrowings
In U.S. offices $ 154,190 $ 169,457 $ 120,123 $ 3,241 $ 6,234 $ 4,195 2.10% 3.68% 3.49%
In offices outside the U.S. (6) 57,406 61,274 24,485 798 837 437 1.39 1.37 1.78
Total $ 211,596 $ 230,731 $ 144,608 $ 4,039 $ 7,071 $ 4,632 1.91% 3.06% 3.20%
Long-term debt (10)
In U.S. offices $ 311,439 $ 266,968 $ 194,979 $14,305 $14,245 $ 9,917 4.59% 5.34% 5.09%
In offices outside the U.S. (6) 37,048 35,803 22,694 1,741 1,865 1,231 4.70 5.21 5.42
Total $ 348,487 $ 302,771 $ 217,673 $16,046 $16,110 $11,148 4.60% 5.32% 5.12%
Total interest-bearing liabilities $1,615,034 $1,714,727 $1,300,477 $52,963 $76,051 $55,683 3.28% 4.44% 4.28%
Demand deposits in U.S. offices 13,757 12,436 10,994
Other non-interest-bearing liabilities (8) 388,873 303,375 236,733
Total liabilities from discontinued operations 17,106 18,171 15,775
Total liabilities $2,034,770 $2,048,709 $1,563,979
Total stockholders’ equity (11) $ 132,708 $ 122,823 $ 115,415
Total liabilities and stockholders’ equity $2,167,478 $2,171,532 $1,679,394
Net interest revenue as a percentage of average
interest-earning assets (12)
In U.S. offices $1,005,414 $1,079,565 $ 880,874 $25,892 $22,069 $19,097 2.58% 2.04% 2.17%
In offices outside the U.S. (6) 746,820 805,357 575,309 27,800 23,309 18,831 3.72 2.89 3.27
Total $1,752,234 $1,884,922 $1,456,183 $53,692 $45,378 $37,928 3.06% 2.41% 2.60%
(1) Interest revenue excludes the taxable equivalent adjustments (based on the U.S. federal statutory tax rate of 35%) of $323 million, $125 million, and $98 million for 2008, 2007, and 2006, respectively.
(2) Interest rates and amounts include the effects of risk management activities associated with the respective asset and liability categories. See Note 24 to the Consolidated Financial Statements on page 189.
(3) Monthly or quarterly averages have been used by certain subsidiaries where daily averages are unavailable.
(4) Detailed average volume, interest revenue and interest expense exclude discontinued operations. See Note 3 to the Consolidated Financial Statements on page 136.
(5) Savings deposits consist of Insured Money Market accounts, NOW accounts, and other savings deposits.
(6) Average rates reflect prevailing local interest rates, including inflationary effects and monetary corrections in certain countries.
(7) Average volumes of securities loaned or sold under agreements to repurchase are reported net pursuant to FIN 41 and interest expense excludes the impact of FIN 41.
(8) The fair value carrying amounts of derivative and foreign exchange contracts are reported in non-interest-earning assets and other non-interest-bearing liabilities.
(9) Interest expense on Trading account liabilities of ICG is reported as a reduction of interest revenue. Interest revenue and interest expense on cash collateral positions are reported in Trading account assets and Trading
account liabilities, respectively.
(10) Excludes hybrid financial instruments and beneficial interests in consolidated VIEs that are classified as Long-term debt, as these obligations are accounted for at fair value with changes recorded in Principal
transactions. In addition, the majority of the funding provided by Treasury to CitiCapital operations is excluded from this line.
(11) Includes stockholders’ equity from discontinued operations.
(12) Includes allocations for capital and funding costs based on the location of the asset.
Reclassified to conform to the current period’s presentation.
84