Citibank 2008 Annual Report Download - page 150
Download and view the complete annual report
Please find page 150 of the 2008 Citibank annual report below. You can navigate through the pages in the report by either clicking on the pages listed below, or by using the keyword search tool below to find specific information within the annual report.-
 1
1 -
2
-
3
-
4
-
5
-
6
-
7
-
8
-
9
-
10
-
11
-
12
-
13
-
14
-
15
-
16
-
17
-
18
-
19
-
20
-
21
-
22
-
23
-
24
-
25
-
26
-
27
-
28
-
29
-
30
-
31
-
32
-
33
-
34
-
35
-
36
-
37
-
38
-
39
-
40
-
41
-
42
-
43
-
44
-
45
-
46
-
47
-
48
-
49
-
50
-
51
-
52
-
53
-
54
-
55
-
56
-
57
-
58
-
59
-
60
-
61
-
62
-
63
-
64
-
65
-
66
-
67
-
68
-
69
-
70
-
71
-
72
-
73
-
74
-
75
-
76
-
77
-
78
-
79
-
80
-
81
-
82
-
83
-
84
-
85
-
86
-
87
-
88
-
89
-
90
-
91
-
92
-
93
-
94
-
95
-
96
-
97
-
98
-
99
-
100
-
101
-
102
-
103
-
104
-
105
-
106
-
107
-
108
-
109
-
110
-
111
-
112
-
113
-
114
-
115
-
116
-
117
-
118
-
119
-
120
-
121
-
122
-
123
-
124
-
125
-
126
-
127
-
128
-
129
-
130
-
131
-
132
-
133
-
134
-
135
-
136
-
137
-
138
-
139
-
 140
140 -
 141
141 -
 142
142 -
 143
143 -
 144
144 -
 145
145 -
 146
146 -
 147
147 -
 148
148 -
 149
149 -
 150
150 -
 151
151 -
 152
152 -
 153
153 -
 154
154 -
 155
155 -
 156
156 -
 157
157 -
 158
158 -
 159
159 -
 160
160 -
161
-
162
-
163
-
164
-
165
-
166
-
167
-
168
-
169
-
170
-
171
-
172
-
173
-
174
-
175
-
176
-
177
-
178
-
179
-
180
-
181
-
182
-
183
-
184
-
185
-
186
-
187
-
188
-
189
-
190
-
191
-
192
-
193
-
194
-
195
-
196
-
197
-
198
-
199
-
200
-
201
-
202
-
203
-
204
-
205
-
206
-
207
-
208
-
209
-
210
-
211
-
212
-
213
-
214
-
215
-
216
-
217
-
218
-
219
-
220
-
221
-
222
-
223
-
224
-
225
-
226
-
227
-
228
-
229
-
230
-
231
-
232
-
233
-
234
-
235
-
236
-
237
-
238
-
239
-
240
-
241
-
242
-
243
-
244
-
245
-
246
-
247
-
248
-
249
-
250
-
251
-
252
 |
 |

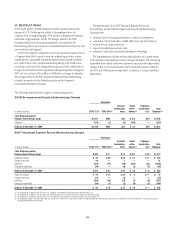
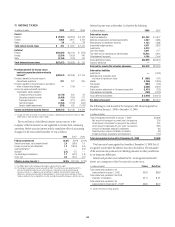
9. RETIREMENT BENEFITS
The Company has several non-contributory defined benefit pension plans
covering substantially all U.S. employees in 2008 and has various defined
benefit pension and termination indemnity plans covering employees
outside the United States. The U.S. qualified defined benefit plan provides
benefits under a cash balance formula. However, employees satisfying
certain age and service requirements remain covered by a prior final
average pay formula under that plan. Effective January 1, 2008, the U.S.
qualified pension plan was frozen. Accordingly, no additional
compensation-based contributions were credited to the cash balance plan
for existing plan participants. However, employees still covered under the
prior final pay plan will continue to accrue benefits. The Company also
offers postretirement health care and life insurance benefits to certain
eligible U.S. retired employees, as well as to certain eligible employees
outside the United States.
The following tables summarize the components of net (benefit) expense
recognized in the Consolidated Statement of Income and the funded status
and amounts recognized in the Consolidated Balance Sheet for the
Company’s U.S. qualified pension plan, postretirement plans and plans
outside the United States. The Company uses a December 31 measurement
date for the U.S. plans as well as the plans outside the United States.
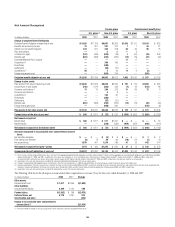
Net (Benefit) Expense
Pension plans Postretirement benefit plans
U.S. plans (1) Non-U.S. plans U.S. plans Non-U.S. plans
In millions of dollars 2008 2007 2006 2008 2007 2006 2008 2007 2006 2008 2007 2006
Benefits earned during the year $23 $ 301 $ 260 $ 201 $ 202 $ 164 $1 $1 $2 $36 $27 $21
Interest cost on benefit obligation 674 641 630 354 318 274 62 59 61 96 75 65
Expected return on plan assets (949) (889) (845) (487) (477) (384) (12) (12) (13) (109) (103) (78)
Amortization of unrecognized:
Net transition obligation ——— 122——— ———
Prior service cost (benefit) (2) (3) (19) 431—(3) (4) ——1
Net actuarial loss —84 185 24 39 51 43821 13 8
Curtailment (gain) loss (2)(3) 56 — (80) 108 36 7 16 9— ———
Net (benefit) expense $(198) $ 134 $ 131 $ 205 $ 123 $ 115 $71 $57 $54 $44 $12 $17
(1) The U.S. plans exclude nonqualified pension plans, for which the net expense was $38 million in 2008, $45 million in 2007 and $51 million in 2006.
(2) In 2008, the Company recognized a net curtailment loss resulting from accelerated expected payment of benefits following restructuring actions. Restructuring charges for the pension plans include $23 million for the
U.S. plans and $22 million for the non-U.S. plans. Restructuring charges for the postretirement plans include $6 million for U.S. plans. In 2007, the Company recognized a net curtailment loss primarily resulting from
accelerated vesting of benefits under reorganization actions outside the U.S. In 2006, the Company recognized a curtailment gain resulting from the January 1, 2008 freeze of the U.S. qualified pension plan.
(3) The 2008 curtailment loss in the non-U.S pension plans includes $71 million reported under Discontinued operations reflecting the sale of Citigroup’s German retail banking operations to Credit Mutuel.
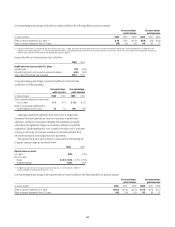
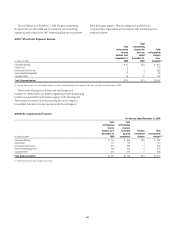
The estimated net actuarial loss, prior service cost and net transition
obligation that will be amortized from Accumulated other comprehensive
income (loss) into net expense in 2009 are approximately $68 million, $2
million and $(1) million, respectively, for defined benefit pension plans. For
postretirement plans, the estimated 2009 net actuarial loss and service cost
are approximately $21 million and $(1) million, respectively.
144