Citibank 2008 Annual Report Download - page 32
Download and view the complete annual report
Please find page 32 of the 2008 Citibank annual report below. You can navigate through the pages in the report by either clicking on the pages listed below, or by using the keyword search tool below to find specific information within the annual report.-
 1
1 -
2
-
3
-
4
-
5
-
6
-
7
-
8
-
9
-
10
-
11
-
12
-
13
-
14
-
15
-
16
-
17
-
18
-
19
-
20
-
21
-
 22
22 -
 23
23 -
 24
24 -
 25
25 -
 26
26 -
 27
27 -
 28
28 -
 29
29 -
 30
30 -
 31
31 -
 32
32 -
 33
33 -
 34
34 -
 35
35 -
 36
36 -
 37
37 -
 38
38 -
 39
39 -
 40
40 -
 41
41 -
 42
42 -
43
-
44
-
45
-
46
-
47
-
48
-
49
-
50
-
51
-
52
-
53
-
54
-
55
-
56
-
57
-
58
-
59
-
60
-
61
-
62
-
63
-
64
-
65
-
66
-
67
-
68
-
69
-
70
-
71
-
72
-
73
-
74
-
75
-
76
-
77
-
78
-
79
-
80
-
81
-
82
-
83
-
84
-
85
-
86
-
87
-
88
-
89
-
90
-
91
-
92
-
93
-
94
-
95
-
96
-
97
-
98
-
99
-
100
-
101
-
102
-
103
-
104
-
105
-
106
-
107
-
108
-
109
-
110
-
111
-
112
-
113
-
114
-
115
-
116
-
117
-
118
-
119
-
120
-
121
-
122
-
123
-
124
-
125
-
126
-
127
-
128
-
129
-
130
-
131
-
132
-
133
-
134
-
135
-
136
-
137
-
138
-
139
-
140
-
141
-
142
-
143
-
144
-
145
-
146
-
147
-
148
-
149
-
150
-
151
-
152
-
153
-
154
-
155
-
156
-
157
-
158
-
159
-
160
-
161
-
162
-
163
-
164
-
165
-
166
-
167
-
168
-
169
-
170
-
171
-
172
-
173
-
174
-
175
-
176
-
177
-
178
-
179
-
180
-
181
-
182
-
183
-
184
-
185
-
186
-
187
-
188
-
189
-
190
-
191
-
192
-
193
-
194
-
195
-
196
-
197
-
198
-
199
-
200
-
201
-
202
-
203
-
204
-
205
-
206
-
207
-
208
-
209
-
210
-
211
-
212
-
213
-
214
-
215
-
216
-
217
-
218
-
219
-
220
-
221
-
222
-
223
-
224
-
225
-
226
-
227
-
228
-
229
-
230
-
231
-
232
-
233
-
234
-
235
-
236
-
237
-
238
-
239
-
240
-
241
-
242
-
243
-
244
-
245
-
246
-
247
-
248
-
249
-
250
-
251
-
252
 |
 |

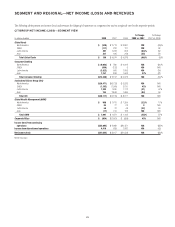
CITIGROUP NET INCOME (LOSS)—REGIONAL VIEW
In millions of dollars 2008 2007 2006
% Change
2008 vs. 2007
% Change
2007 vs. 2006
North America
Global Cards $ (529) $ 2,713 $ 3,887 NM (30)%
Consumer Banking (9,003) 780 4,002 NM (81)
ICG (20,471) (6,733) 3,533 NM NM
Securities and Banking (20,759) (6,929) 3,434 NM NM
Transaction Services 288 196 99 47% 98
GWM 968 1,415 1,209 (32) 17
Total North America $(29,035) $(1,825) $12,631 NM NM
EMEA
Global Cards $ (117) $ 232 $ 121 NM 92%
Consumer Banking (606) (122) 5 NM NM
ICG (1,102) (1,900) 2,010 42% NM
Securities and Banking (2,106) (2,573) 1,547 18 NM
Transaction Services 1,004 673 463 49 45
GWM 84 77 23 9NM
Total EMEA $ (1,741) $(1,713) $ 2,159 (2)% NM
Latin America
Global Cards $ 491 $ 1,233 $ 652 (60)% 89%
Consumer Banking (3,822) 660 1,003 NM (34)
ICG 1,292 1,630 1,112 (21) 47
Securities and Banking 765 1,221 854 (37) 43
Transaction Services 527 409 258 29 59
GWM 56 72 48 (22) 50
Total Latin America $ (1,983) $ 3,595 $ 2,815 NM 28%
Asia
Global Cards $ 321 $ 496 $ 318 (35)% 56%
Consumer Banking 1,151 839 1,063 37 (21)
ICG 164 2,848 1,956 (94) 46
Securities and Banking (988) 1,904 1,345 NM 42
Transaction Services 1,152 944 611 22 55
GWM (17) 410 163 NM NM
Total Asia $ 1,619 $ 4,593 $ 3,500 (65)% 31%
Corporate/Other $ (954) $(1,661) $ (654) 43% NM
Income (loss) from continuing operations $(32,094) $ 2,989 $20,451 NM (85)%
Income from discontinued operations 4,410 628 1,087 NM (42)
Net income (loss) $(27,684) $ 3,617 $21,538 NM (83)%
NM Not meaningful
26