Citibank 2008 Annual Report Download - page 166
Download and view the complete annual report
Please find page 166 of the 2008 Citibank annual report below. You can navigate through the pages in the report by either clicking on the pages listed below, or by using the keyword search tool below to find specific information within the annual report.-
 1
1 -
2
-
3
-
4
-
5
-
6
-
7
-
8
-
9
-
10
-
11
-
12
-
13
-
14
-
15
-
16
-
17
-
18
-
19
-
20
-
21
-
22
-
23
-
24
-
25
-
26
-
27
-
28
-
29
-
30
-
31
-
32
-
33
-
34
-
35
-
36
-
37
-
38
-
39
-
40
-
41
-
42
-
43
-
44
-
45
-
46
-
47
-
48
-
49
-
50
-
51
-
52
-
53
-
54
-
55
-
56
-
57
-
58
-
59
-
60
-
61
-
62
-
63
-
64
-
65
-
66
-
67
-
68
-
69
-
70
-
71
-
72
-
73
-
74
-
75
-
76
-
77
-
78
-
79
-
80
-
81
-
82
-
83
-
84
-
85
-
86
-
87
-
88
-
89
-
90
-
91
-
92
-
93
-
94
-
95
-
96
-
97
-
98
-
99
-
100
-
101
-
102
-
103
-
104
-
105
-
106
-
107
-
108
-
109
-
110
-
111
-
112
-
113
-
114
-
115
-
116
-
117
-
118
-
119
-
120
-
121
-
122
-
123
-
124
-
125
-
126
-
127
-
128
-
129
-
130
-
131
-
132
-
133
-
134
-
135
-
136
-
137
-
138
-
139
-
140
-
141
-
142
-
143
-
144
-
145
-
146
-
147
-
148
-
149
-
150
-
151
-
152
-
153
-
154
-
155
-
 156
156 -
 157
157 -
 158
158 -
 159
159 -
 160
160 -
 161
161 -
 162
162 -
 163
163 -
 164
164 -
 165
165 -
 166
166 -
 167
167 -
 168
168 -
 169
169 -
 170
170 -
 171
171 -
 172
172 -
 173
173 -
 174
174 -
 175
175 -
 176
176 -
177
-
178
-
179
-
180
-
181
-
182
-
183
-
184
-
185
-
186
-
187
-
188
-
189
-
190
-
191
-
192
-
193
-
194
-
195
-
196
-
197
-
198
-
199
-
200
-
201
-
202
-
203
-
204
-
205
-
206
-
207
-
208
-
209
-
210
-
211
-
212
-
213
-
214
-
215
-
216
-
217
-
218
-
219
-
220
-
221
-
222
-
223
-
224
-
225
-
226
-
227
-
228
-
229
-
230
-
231
-
232
-
233
-
234
-
235
-
236
-
237
-
238
-
239
-
240
-
241
-
242
-
243
-
244
-
245
-
246
-
247
-
248
-
249
-
250
-
251
-
252
 |
 |

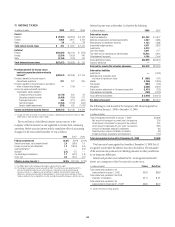
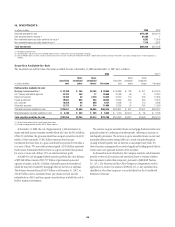
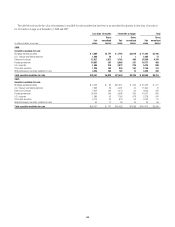
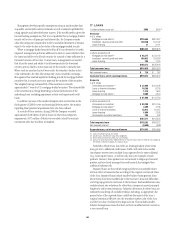
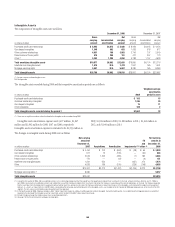
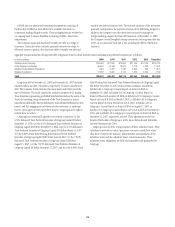
The following table presents the amortized cost and fair value of debt
securities available-for-sale by contractual maturity dates as of December 31,
2008:
In millions of dollars
Amortized
cost Fair value
Mortgage-backed securities (1)
Due within 1 year $ 87 $ 80
After 1 but within 5 years 639 567
After 5 but within 10 years 1,362 1,141
After 10 years (2) 30,710 28,080
Total $ 32,798 $ 29,868
U.S. Treasury and federal agencies
Due within 1 year $ 15,736 $ 15,846
After 1 but within 5 years 5,755 5,907
After 5 but within 10 years 1,902 1,977
After 10 years (2) 309 235
Total $ 23,702 $ 23,965
State and municipal
Due within 1 year $ 214 $ 214
After 1 but within 5 years 84 84
After 5 but within 10 years 411 406
After 10 years (2) 17,647 13,120
Total $ 18,356 $ 13,824
Foreign government
Due within 1 year $ 26,481 $ 26,937
After 1 but within 5 years 45,452 45,462
After 5 but within 10 years 6,771 6,899
After 10 years (2) 601 744
Total $ 79,305 $ 80,042
All other (3)
Due within 1 year $ 4,160 $ 4,319
After 1 but within 5 years 2,662 2,692
After 5 but within 10 years 12,557 11,842
After 10 years (2) 3,051 2,774
Total $ 22,430 $ 21,627
Total debt securities available-for-sale $176,591 $169,326
(1) Includes mortgage-backed securities of U.S. federal agencies.
(2) Investments with no stated maturities are included as contractual maturities of greater than 10 years.
Actual maturities may differ due to call or prepayment rights.
(3) Includes U.S. corporate, asset-backed securities issued by U.S. corporations, and other debt
securities.
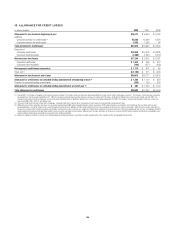
The following table presents interest and dividends on investments:
In millions of dollars 2008 2007 2006
Taxable interest $ 9,407 $12,169 $ 9,096
Interest exempt from U.S. federal income tax 836 897 660
Dividends 475 357 584
Total interest and dividends $10,718 $13,423 $10,340
The following table presents realized gains and losses on investments. The
gross realized investment losses include losses from other-than-temporary
impairment:
In millions of dollars 2008 2007 2006
Gross realized investment gains $ 1,044 $1,435 $2,119
Gross realized investment losses (3,105) (267) (328)
Net realized gains (losses) $(2,061) $1,168 $1,791
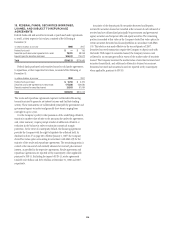
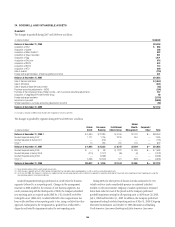
Debt Securities Held-to-Maturity
During the fourth quarter of 2008, the Company reviewed portfolios of debt
securities classified in Trading account assets and available-for-sale
securities, and identified positions where there has been a change of intent to
hold the debt securities for much longer periods of time than originally
anticipated. The Company believes that the expected cash flows to be
generated from holding the assets significantly exceed their current fair
value, which has been significantly and adversely impacted by the reduced
liquidity in the global financial markets.
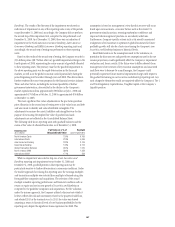
SFAS 115 requires transfers of securities out of the trading category be
rare. Citigroup made a number of transfers out of the trading and
available-for-sale categories in order to better reflect the revised intentions of
the Company in response to the recent significant deterioration in market
conditions, which were especially acute during the fourth quarter of 2008.
These rare market conditions were not foreseen at the initial purchase date of
the securities. Most of the debt securities previously classified as trading were
bought and held principally for the purpose of selling them in the short
term, many in the context of Citigroup’s acting as a market maker. At the
date of acquisition, most of these positions were liquid, and the Company
expected active and frequent buying and selling with the objective of
generating profits on short-term differences in price. However, subsequent
declines in value of these securities are primarily related to the ongoing
widening of market credit spreads reflecting increased risk and liquidity
premiums that buyers are currently demanding. As market liquidity has
decreased, the primary buyers for these securities have typically demanded
returns on investments that are significantly higher than previously
experienced.
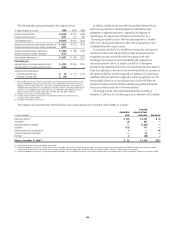
Reclassification of debt securities were made at fair value on the date of
transfer. The December 31, 2008 carrying value of the securities transferred
from Trading account assets and available-for-sale securities was $33.3
billion and $27.0 billion, respectively. The Company purchased an
additional $4.2 billion of held-to-maturity securities during the fourth
quarter of 2008, in accordance with prior commitments.
160