Citibank 2008 Annual Report Download - page 152
Download and view the complete annual report
Please find page 152 of the 2008 Citibank annual report below. You can navigate through the pages in the report by either clicking on the pages listed below, or by using the keyword search tool below to find specific information within the annual report.-
 1
1 -
2
-
3
-
4
-
5
-
6
-
7
-
8
-
9
-
10
-
11
-
12
-
13
-
14
-
15
-
16
-
17
-
18
-
19
-
20
-
21
-
22
-
23
-
24
-
25
-
26
-
27
-
28
-
29
-
30
-
31
-
32
-
33
-
34
-
35
-
36
-
37
-
38
-
39
-
40
-
41
-
42
-
43
-
44
-
45
-
46
-
47
-
48
-
49
-
50
-
51
-
52
-
53
-
54
-
55
-
56
-
57
-
58
-
59
-
60
-
61
-
62
-
63
-
64
-
65
-
66
-
67
-
68
-
69
-
70
-
71
-
72
-
73
-
74
-
75
-
76
-
77
-
78
-
79
-
80
-
81
-
82
-
83
-
84
-
85
-
86
-
87
-
88
-
89
-
90
-
91
-
92
-
93
-
94
-
95
-
96
-
97
-
98
-
99
-
100
-
101
-
102
-
103
-
104
-
105
-
106
-
107
-
108
-
109
-
110
-
111
-
112
-
113
-
114
-
115
-
116
-
117
-
118
-
119
-
120
-
121
-
122
-
123
-
124
-
125
-
126
-
127
-
128
-
129
-
130
-
131
-
132
-
133
-
134
-
135
-
136
-
137
-
138
-
139
-
140
-
141
-
 142
142 -
 143
143 -
 144
144 -
 145
145 -
 146
146 -
 147
147 -
 148
148 -
 149
149 -
 150
150 -
 151
151 -
 152
152 -
 153
153 -
 154
154 -
 155
155 -
 156
156 -
 157
157 -
 158
158 -
 159
159 -
 160
160 -
 161
161 -
 162
162 -
163
-
164
-
165
-
166
-
167
-
168
-
169
-
170
-
171
-
172
-
173
-
174
-
175
-
176
-
177
-
178
-
179
-
180
-
181
-
182
-
183
-
184
-
185
-
186
-
187
-
188
-
189
-
190
-
191
-
192
-
193
-
194
-
195
-
196
-
197
-
198
-
199
-
200
-
201
-
202
-
203
-
204
-
205
-
206
-
207
-
208
-
209
-
210
-
211
-
212
-
213
-
214
-
215
-
216
-
217
-
218
-
219
-
220
-
221
-
222
-
223
-
224
-
225
-
226
-
227
-
228
-
229
-
230
-
231
-
232
-
233
-
234
-
235
-
236
-
237
-
238
-
239
-
240
-
241
-
242
-
243
-
244
-
245
-
246
-
247
-
248
-
249
-
250
-
251
-
252
 |
 |

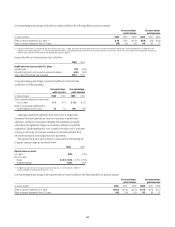
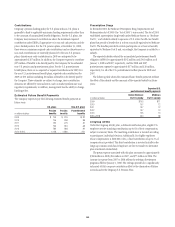
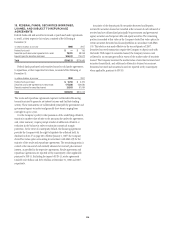
At the end of 2008 and 2007, for both qualified and nonqualified plans
and for both funded and unfunded plans, the aggregate projected benefit
obligation (PBO), the aggregate accumulated benefit obligation (ABO), and
the aggregate fair value of plan assets for pension plans with a projected
benefit obligation in excess of plan assets, and pension plans with an
accumulated benefit obligation in excess of plan assets, were as follows:
PBO exceeds fair value of plan
assets
ABO exceeds fair value of plan
assets
U.S. plans Non-U.S. plans U.S. plans Non-U.S. plans
In millions of dollars 2008 2007 2008 2007 2008 2007 2008 2007
Projected benefit obligation $586 $611 $1,866 $944 $586 $611 $1,374 $804
Accumulated benefit obligation 580 604 1,640 749 580 604 1,231 668
Fair value of plan assets ——1,328 505 ——875 396
Combined plan assets for the U.S. and non-U.S. pension plans, excluding U.S. nonqualified plans, exceeded the accumulated benefit obligations by $1.0
billion and $3.1 billion at December 31, 2008 and December 31, 2007, respectively.
Assumptions
The discount rate and future rate of compensation assumptions used in
determining pension and postretirement benefit obligations and net benefit
expense for the Company’s plans are shown in the following table:
At year end 2008 2007
Discount rate
U.S. plans (1)
Pension 6.1% 6.2%
Postretirement 6.0 6.0
Non-U.S. plans
Range (2) 1.75 to 17.0 2.0 to 10.25
Weighted average 6.6 6.2
Future compensation increase rate
U.S. plans (3) 3.0 3.0
Non-U.S. plans
Range (2) 1.0 to 11.5 3.0 to 8.25
Weighted average 4.5 4.4
During the year 2008 2007
Discount rate
U.S. plans (1)
Pension 6.2% 5.9%
Postretirement 6.0 5.7
Non-U.S. plans
Range 2.0 to 10.25 2.25 to 11.0
Weighted average 6.2 6.5
Future compensation increase rate
U.S. plans (3) 3.0 4.0
Non-U.S. plans
Range (4) 1.0 to 8.25 1.0 to 10.0
Weighted average 4.4 4.3
(1) Weighted average rates for the U.S. plans equal the stated rates.
(2) At December 31, 2008, the range includes plans in countries that were not reported earlier due to
immateriality. Discount rates for the same group of countries as of December 31, 2007 were 2.0% to
13.0%. Future compensation increase rates for the same group of countries as of December 31, 2007
was 1.5% to 9.0%.
(3) Effective January 1, 2008, the U.S. qualified pension plan was frozen. Only the future compensation
increases for the grandfathered employees will affect future pension expense and obligations. Future
compensation increase rates for small groups of employees were 4.0% or 6.0%.
(4) Future compensation increase rate for the non-U.S plans differs from the year end 2007 rates due to
inclusion of newly material plans in 2008.
146