Citibank 2008 Annual Report Download - page 191
Download and view the complete annual report
Please find page 191 of the 2008 Citibank annual report below. You can navigate through the pages in the report by either clicking on the pages listed below, or by using the keyword search tool below to find specific information within the annual report.-
 1
1 -
2
-
3
-
4
-
5
-
6
-
7
-
8
-
9
-
10
-
11
-
12
-
13
-
14
-
15
-
16
-
17
-
18
-
19
-
20
-
21
-
22
-
23
-
24
-
25
-
26
-
27
-
28
-
29
-
30
-
31
-
32
-
33
-
34
-
35
-
36
-
37
-
38
-
39
-
40
-
41
-
42
-
43
-
44
-
45
-
46
-
47
-
48
-
49
-
50
-
51
-
52
-
53
-
54
-
55
-
56
-
57
-
58
-
59
-
60
-
61
-
62
-
63
-
64
-
65
-
66
-
67
-
68
-
69
-
70
-
71
-
72
-
73
-
74
-
75
-
76
-
77
-
78
-
79
-
80
-
81
-
82
-
83
-
84
-
85
-
86
-
87
-
88
-
89
-
90
-
91
-
92
-
93
-
94
-
95
-
96
-
97
-
98
-
99
-
100
-
101
-
102
-
103
-
104
-
105
-
106
-
107
-
108
-
109
-
110
-
111
-
112
-
113
-
114
-
115
-
116
-
117
-
118
-
119
-
120
-
121
-
122
-
123
-
124
-
125
-
126
-
127
-
128
-
129
-
130
-
131
-
132
-
133
-
134
-
135
-
136
-
137
-
138
-
139
-
140
-
141
-
142
-
143
-
144
-
145
-
146
-
147
-
148
-
149
-
150
-
151
-
152
-
153
-
154
-
155
-
156
-
157
-
158
-
159
-
160
-
161
-
162
-
163
-
164
-
165
-
166
-
167
-
168
-
169
-
170
-
171
-
172
-
173
-
174
-
175
-
176
-
177
-
178
-
179
-
180
-
 181
181 -
 182
182 -
 183
183 -
 184
184 -
 185
185 -
 186
186 -
 187
187 -
 188
188 -
 189
189 -
 190
190 -
 191
191 -
 192
192 -
 193
193 -
 194
194 -
 195
195 -
 196
196 -
 197
197 -
 198
198 -
 199
199 -
 200
200 -
 201
201 -
202
-
203
-
204
-
205
-
206
-
207
-
208
-
209
-
210
-
211
-
212
-
213
-
214
-
215
-
216
-
217
-
218
-
219
-
220
-
221
-
222
-
223
-
224
-
225
-
226
-
227
-
228
-
229
-
230
-
231
-
232
-
233
-
234
-
235
-
236
-
237
-
238
-
239
-
240
-
241
-
242
-
243
-
244
-
245
-
246
-
247
-
248
-
249
-
250
-
251
-
252
 |
 |

instruments. Any cash raised from investors is invested in a portfolio of
collateral securities or investment contracts. The collateral is then used to
support the CDO’s obligations on the credit default swaps written to
counterparties. The Company’s continuing involvement in synthetic CDOs
generally includes purchasing credit protection through credit default swaps
with the CDO, owning a portion of the capital structure of the CDO, in the
form of both unfunded derivative positions (primarily super senior exposures
discussed below) and funded notes, entering into interest-rate swap and
total-return swap transactions with the CDO, lending to the CDO, and
making a market in those funded notes.
A collateralized loan obligation (CLO) is substantially similar to the CDO
transactions described above, except that the assets owned by the SPE (either
cash instruments or synthetic exposures through derivative instruments) are
corporate loans and to a lesser extent corporate bonds, rather than asset-
backed debt securities.
Consolidation
The Company has retained significant portions of the “super senior”
positions issued by certain CDOs. These positions are referred to as “super
senior” because they represent the most senior positions in the CDO and, at
the time of structuring, were senior to tranches rated AAA by independent
rating agencies. These positions include facilities structured in the form of
short-term commercial paper, where the Company wrote put options
(“liquidity puts”) to certain CDOs. Under the terms of the liquidity puts, if
the CDO was unable to issue commercial paper at a rate below a specified
maximum (generally LIBOR + 35bps to LIBOR + 40 bps), the Company was
obligated to fund the senior tranche of the CDO at a specified interest rate. As
of December 31, 2008, the Company had purchased all $25 billion of the
commercial paper subject to the liquidity puts.
Since inception of many CDO transactions, the subordinate tranches of
the CDOs have diminished significantly in value and in rating. The declines
in value of the subordinate tranches and in the super senior tranches
indicate that the super senior tranches are now exposed to a significant
portion of the expected losses of the CDOs, based on current market
assumptions. The Company evaluates these transactions for consolidation
when reconsideration events occur, as defined in FIN 46(R).
Upon a reconsideration event, the Company is at risk for consolidation
only if the Company owns a majority of either a single tranche or a group of
tranches that absorb the remaining risk of the CDO. Due to reconsideration
events during 2007 and 2008, the Company has consolidated 34 of the 46
CDOs/CLOs in which the Company holds a majority of the senior interests of
the transaction.
The Company continues to monitor its involvement in unconsolidated
VIEs and if the Company were to acquire additional interests in these vehicles
or if the CDOs’ contractual arrangements were to be changed to reallocate
expected losses or residual returns among the various interest holders, the
Company may be required to consolidate the CDOs. For cash CDOs, the net
result of such consolidation would be to gross up the Company’s balance
sheet by the current fair value of the subordinate securities held by third
parties, which amounts are not considered material. For synthetic CDOs, the
net result of such consolidation may reduce the Company’s balance sheet by
eliminating intercompany derivative receivables and payables in
consolidation.
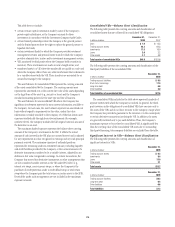
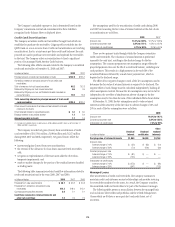
Cash Flows and Retained Interests
The following tables summarize selected cash flow information related to
CDO and CLO securitizations for the year 2008:
In billions of dollars CDOs CLOs
Cash flows received on retained interests 0.1 —
The key assumptions, used for the securitization of CDOs and CLOs during
2008 in measuring the fair value of retained interests at the date of sale or
securitization, are as follows:
CDOs CLOs
Discount rate 28.5% to 31.2% 4.7% to 5.2%
The effect of two negative changes in discount rates used to determine the
fair value of retained interests is disclosed below.
In millions of dollars CDOs CLOs
Carrying value of retained interests $928 $763
Discount rates
Adverse change of 10% $(21) $ (11)
Adverse change of 20% (41) (23)
Asset-Based Financing
The Company provides loans and other forms of financing to VIEs that hold
assets. Those loans are subject to the same credit approvals as all other loans
originated or purchased by the Company and related loan loss reserves are
reported as part of the Company’s Allowance for credit losses in Note 18 on
page 165. Financings in the form of debt securities or derivatives are, in most
circumstances, reported in Trading account assets and accounted for at fair
value through earnings.
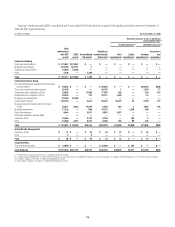
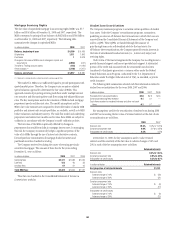
The primary types of asset-based financing, total assets of the
unconsolidated VIEs with significant involvement and the Company’s
maximum exposure to loss at December 31, 2008 are shown below. For the
Company to realize that maximum loss, the VIE (borrower) would have to
default with no recovery from the assets held by the VIE.
In billions of dollars
Type
Total
assets
Maximum
exposure
Commercial and other real estate $46.9 $ 9.3
Hedge funds and equities 28.2 7.1
Corporate loans 9.5 8.1
Asset purchasing vehicles/SIVs 2.4 0.5
Airplanes, ships and other assets 11.3 3.2
Total $98.3 $28.2
The Company’s involvement in the asset purchasing vehicles and SIVs
sponsored and managed by third parties is primarily in the form of provided
backstop liquidity. Those vehicles finance a majority of their asset purchases
with commercial paper and short-term notes. Certain of the assets owned by
the vehicles have suffered significant declines in fair value, leading to an
inability to re-issue maturing commercial paper and short-term notes.
Citigroup has been required to provide loans to those vehicles to replace
maturing commercial paper and short-term notes, in accordance with the
original terms of the backstop liquidity facilities.
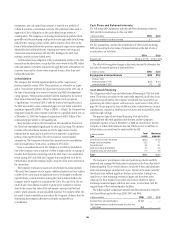
The following table summarizes selected cash flow information related to
asset-based financing for the years 2008, 2007 and 2006:
In billions of dollars 2008 2007 2006
Proceeds from new securitizations $ 1.7 ——
Cash flows received on retained interests and other net
cash flows 0.4 ——
185