Citibank 2008 Annual Report Download - page 45
Download and view the complete annual report
Please find page 45 of the 2008 Citibank annual report below. You can navigate through the pages in the report by either clicking on the pages listed below, or by using the keyword search tool below to find specific information within the annual report.-
 1
1 -
2
-
3
-
4
-
5
-
6
-
7
-
8
-
9
-
10
-
11
-
12
-
13
-
14
-
15
-
16
-
17
-
18
-
19
-
20
-
21
-
22
-
23
-
24
-
25
-
26
-
27
-
28
-
29
-
30
-
31
-
32
-
33
-
34
-
 35
35 -
 36
36 -
 37
37 -
 38
38 -
 39
39 -
 40
40 -
 41
41 -
 42
42 -
 43
43 -
 44
44 -
 45
45 -
 46
46 -
 47
47 -
 48
48 -
 49
49 -
 50
50 -
 51
51 -
 52
52 -
 53
53 -
 54
54 -
 55
55 -
56
-
57
-
58
-
59
-
60
-
61
-
62
-
63
-
64
-
65
-
66
-
67
-
68
-
69
-
70
-
71
-
72
-
73
-
74
-
75
-
76
-
77
-
78
-
79
-
80
-
81
-
82
-
83
-
84
-
85
-
86
-
87
-
88
-
89
-
90
-
91
-
92
-
93
-
94
-
95
-
96
-
97
-
98
-
99
-
100
-
101
-
102
-
103
-
104
-
105
-
106
-
107
-
108
-
109
-
110
-
111
-
112
-
113
-
114
-
115
-
116
-
117
-
118
-
119
-
120
-
121
-
122
-
123
-
124
-
125
-
126
-
127
-
128
-
129
-
130
-
131
-
132
-
133
-
134
-
135
-
136
-
137
-
138
-
139
-
140
-
141
-
142
-
143
-
144
-
145
-
146
-
147
-
148
-
149
-
150
-
151
-
152
-
153
-
154
-
155
-
156
-
157
-
158
-
159
-
160
-
161
-
162
-
163
-
164
-
165
-
166
-
167
-
168
-
169
-
170
-
171
-
172
-
173
-
174
-
175
-
176
-
177
-
178
-
179
-
180
-
181
-
182
-
183
-
184
-
185
-
186
-
187
-
188
-
189
-
190
-
191
-
192
-
193
-
194
-
195
-
196
-
197
-
198
-
199
-
200
-
201
-
202
-
203
-
204
-
205
-
206
-
207
-
208
-
209
-
210
-
211
-
212
-
213
-
214
-
215
-
216
-
217
-
218
-
219
-
220
-
221
-
222
-
223
-
224
-
225
-
226
-
227
-
228
-
229
-
230
-
231
-
232
-
233
-
234
-
235
-
236
-
237
-
238
-
239
-
240
-
241
-
242
-
243
-
244
-
245
-
246
-
247
-
248
-
249
-
250
-
251
-
252
 |
 |

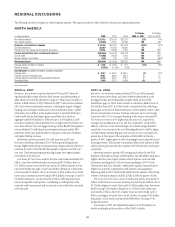
REGIONAL DISCUSSIONS
The following are the four regions in which Citigroup operates. The regional results are fully reflected in the previous segment discussions.
NORTH AMERICA
In millions of dollars 2008 2007 2006
% Change
2008 vs. 2007
% Change
2007 vs. 2006
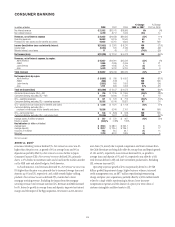
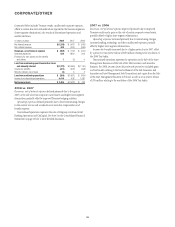
Net interest revenue $ 28,713 $23,333 $20,557 23% 14%
Non-interest revenue (14,969) 14,301 30,696 NM (53)
Revenues, net of interest expense $ 13,744 $37,634 $51,253 (63)% (27)%
Operating expenses 36,407 30,186 28,380 21 6
Provisions for loan losses and for benefits and claims 23,842 11,838 4,080 NM NM
Income (loss) before taxes and minority interest $(46,505) $ (4,390) $18,793 NM NM
Income taxes (17,046) (2,667) 5,920 NM NM
Minority interest, net of taxes (424) 102 242 NM (58)%
Net income (loss) $(29,035) $ (1,825) $12,631 NM NM
Average assets (in billions of dollars) $ 1,188 $ 1,222 $ 971 (3)% 26%
Return on assets (2.44)% (0.15)% 1.30%
Key indicators (in billions of dollars, except in branches)
Average loans $ 429.7 $ 405.2 $ 363.1 6% 12%
Average Consumer Banking loans 298.2 289.8 255.0 314
Average deposits (and other consumer liability balances) 261.6 245.1 218.1 712
Branches/offices 3,989 4,227 4,084 (6) 4
NM Not meaningful.
2008 vs. 2007
Revenues, net of interest expense declined 63% from 2007, driven by
significantly higher losses related to fixed income and credit markets in
S&B, which are more fully described on page 10. These losses resulted in a
decline in S&B revenue of $19.9 billion from 2007. Cards revenue declined
26%, due to lower securitization revenues, reflecting the impact of higher
funding costs and higher credit losses in the securitization trusts, and the
write-down of $1.6 billion in the residual interest in securitized balances.
Cards results also include higher gains on portfolio sales, which in
aggregate added $548 million to 2008 revenue vs. $393 million in 2007.
Consumer Banking revenue decreased 2%, as higher interest revenue was
more than offset by lower mortgage servicing. Global Wealth Management
revenue declined 5% reflecting lower investment revenues and the ARS
settlement, which were partially offset by the gain on the sale of CitiStreet
and higher lending revenues.
Operating expenses increased 21%, with increases in ICG and
Consumer Banking, reflecting a $5.107 billion goodwill impairment
charge, higher restructuring and repositioning charges, partially offset by a
reduction in Cards. Global Wealth Management expenses were flat year
over year. Total restructuring/repositioning charges were approximately
$2.0 billion for the full year.
Provisions for loan losses and for benefits and claims increased $12.0
billion. Consumer Banking credit costs increased $7.3 billion, due to a
$5.1 billion increase in net credit losses and a $2.2 billion increase in loan
loss reserve builds (see page 11 and 32 for further discussion). Cards credit
costs increased $1.9 billion, due to an increase of $916 million in net credit
losses and an increase in reserve builds of $936 million (see page 11 and 30
for further discussion). ICG increased $2.2 billion, reflecting loan losses
reserves for specific counterparties, a weakening in credit quality in the
corporate credit environment and an increase in net credit losses associated
with loan sales.
2007 vs. 2006
Revenues, net of interest expense declined 27% from 2006, primarily
driven by pretax write-downs and losses related to deterioration in the
mortgage-backed and credit markets in S&B, which are more fully
described on page 34. These losses resulted in a decline in S&B revenue of
$16.4 billion from 2007. In Global Cards, revenues were flat, reflecting a
pretax gain on the sale of MasterCard shares of $393 million in 2007, offset
by lower securitization revenues. Purchase sales were up 6% and average
loans were down 7%. In Consumer Banking, total revenues increased 9%.
Net interest revenue was 9% higher than the prior year, as growth in
average loans and deposits, up 14% and 16%, respectively, was partially
offset by a decrease in net interest margin. Net interest margin declined
mainly due to an increase in the cost of funding driven by a shift to higher
cost Direct Bank and time deposits. Non-interest revenue increased 10%,
mainly due to the impact of the acquisition of ABN AMRO in the first
quarter of 2007, higher gains on sales of mortgage loans and growth in net
servicing revenues. This increase was partially offset by the absence of $163
million pretax gain from the sale of upstate New York branches in the prior-
year period.
Operating expenses growth of 6% was primarily driven by the VISA
litigation-related pretax charge of $292 million, the ABN AMRO integration,
higher collection costs, higher volume-related expenses, and increased
investment spending due to 202 new branch openings in 2007 (110 in
CitiFinancial and 92 in Citibank). Additionally, expenses increased due to
higher non-incentive compensation staff expenses and acquisitions.
Expense growth in 2007 was favorably affected by the absence of the charge
related to the initial adoption of SFAS 123(R) in the first quarter of 2006.
Provisions for loan losses and for benefits and claims increased $7.8
billion. Credit costs in Consumer Banking increased by $5.6 billion, due to
$1.2 billion higher net credit losses and $4.4 billion higher loan loss reserve
build (see page 32 for further discussion). In Global Cards, credit costs
increased $1.4 billion, driven by a higher loan loss reserve build, up $1.3
billion, and higher net credit losses, up $0.1 billion (see page 30 for further
discussion). In ICG credit costs increased $940 million (see page 35 for
further discussion).
Net income in 2007 also reflected the absence of a $229 million tax
benefit resulting from the resolution of the 2006 Tax Audits.
39