Citibank 2008 Annual Report Download - page 164
Download and view the complete annual report
Please find page 164 of the 2008 Citibank annual report below. You can navigate through the pages in the report by either clicking on the pages listed below, or by using the keyword search tool below to find specific information within the annual report.-
 1
1 -
2
-
3
-
4
-
5
-
6
-
7
-
8
-
9
-
10
-
11
-
12
-
13
-
14
-
15
-
16
-
17
-
18
-
19
-
20
-
21
-
22
-
23
-
24
-
25
-
26
-
27
-
28
-
29
-
30
-
31
-
32
-
33
-
34
-
35
-
36
-
37
-
38
-
39
-
40
-
41
-
42
-
43
-
44
-
45
-
46
-
47
-
48
-
49
-
50
-
51
-
52
-
53
-
54
-
55
-
56
-
57
-
58
-
59
-
60
-
61
-
62
-
63
-
64
-
65
-
66
-
67
-
68
-
69
-
70
-
71
-
72
-
73
-
74
-
75
-
76
-
77
-
78
-
79
-
80
-
81
-
82
-
83
-
84
-
85
-
86
-
87
-
88
-
89
-
90
-
91
-
92
-
93
-
94
-
95
-
96
-
97
-
98
-
99
-
100
-
101
-
102
-
103
-
104
-
105
-
106
-
107
-
108
-
109
-
110
-
111
-
112
-
113
-
114
-
115
-
116
-
117
-
118
-
119
-
120
-
121
-
122
-
123
-
124
-
125
-
126
-
127
-
128
-
129
-
130
-
131
-
132
-
133
-
134
-
135
-
136
-
137
-
138
-
139
-
140
-
141
-
142
-
143
-
144
-
145
-
146
-
147
-
148
-
149
-
150
-
151
-
152
-
153
-
 154
154 -
 155
155 -
 156
156 -
 157
157 -
 158
158 -
 159
159 -
 160
160 -
 161
161 -
 162
162 -
 163
163 -
 164
164 -
 165
165 -
 166
166 -
 167
167 -
 168
168 -
 169
169 -
 170
170 -
 171
171 -
 172
172 -
 173
173 -
 174
174 -
175
-
176
-
177
-
178
-
179
-
180
-
181
-
182
-
183
-
184
-
185
-
186
-
187
-
188
-
189
-
190
-
191
-
192
-
193
-
194
-
195
-
196
-
197
-
198
-
199
-
200
-
201
-
202
-
203
-
204
-
205
-
206
-
207
-
208
-
209
-
210
-
211
-
212
-
213
-
214
-
215
-
216
-
217
-
218
-
219
-
220
-
221
-
222
-
223
-
224
-
225
-
226
-
227
-
228
-
229
-
230
-
231
-
232
-
233
-
234
-
235
-
236
-
237
-
238
-
239
-
240
-
241
-
242
-
243
-
244
-
245
-
246
-
247
-
248
-
249
-
250
-
251
-
252
 |
 |

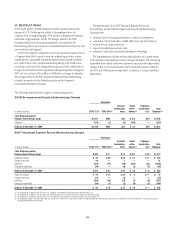
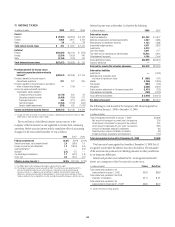
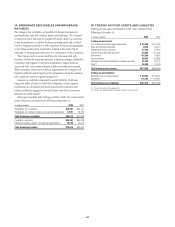
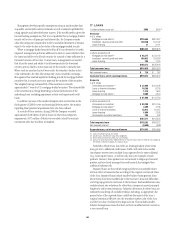
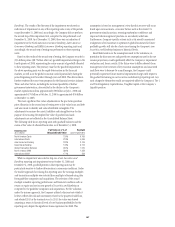
16. INVESTMENTS
In millions of dollars 2008 2007
Securities available-for-sale $175,189 $193,113
Debt securities held-to-maturity (1) 64,459 1
Non-marketable equity securities carried at fair value (2) 9,262 13,603
Non-marketable equity securities carried at cost (3) 7,110 8,291
Total investments $256,020 $215,008
(1) Recorded at amortized cost.
(2) Unrealized gains and losses for non-marketable equity securities carried at fair value are recognized in earnings.
(3) Non-marketable equity securities carried at cost primarily consist of shares issued by the Federal Reserve Bank, Federal Home Loan Bank, foreign central banks and various clearing houses in which Citigroup is a
member.
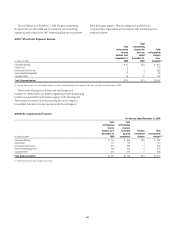
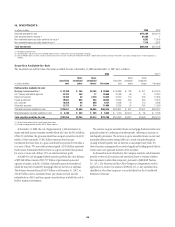
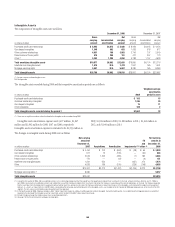
Securities Available-for-Sale
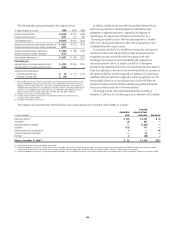
The amortized cost and fair value of securities available-for-sale at December 31, 2008 and December 31, 2007 were as follows:
2008 2007(1)
In millions of dollars
Amortized
cost
Gross
unrealized
gains
Gross
unrealized
losses Fair value
Amortized
cost
Gross
unrealized
gains
Gross
unrealized
losses Fair value
Debt securities available-for-sale:
Mortgage-backed securities (2) $ 32,798 $ 266 $3,196 $ 29,868 $ 63,888 $ 158 $ 971 $ 63,075
U.S. Treasury and federal agencies 23,702 340 77 23,965 19,428 66 70 19,424
State and municipal 18,156 38 4,370 13,824 13,342 120 256 13,206
Foreign government 79,505 945 408 80,042 72,339 396 660 72,075
U.S. corporate 10,258 59 590 9,727 9,648 70 120 9,598
Other debt securities 12,172 42 314 11,900 12,336 97 464 11,969
Total debt securities available-for-sale $176,591 $1,690 $8,955 $169,326 $190,981 $ 907 $2,541 $189,347
Marketable equity securities available-for-sale $ 5,768 $ 554 $ 459 $ 5,863 $ 1,404 $2,420 $ 58 $ 3,766
Total securities available-for-sale $182,359 $2,244 $9,414 $175,189 $192,385 $3,327 $2,599 $193,113
(1) Reclassified to conform to the current periods presentation.
(2) Includes mortgage-backed securities of U.S. federal agencies.
At December 31, 2008, the cost of approximately 5,300 investments in
equity and fixed income securities exceeded their fair value by $9.414 billion.
Of the $9.414 billion, the gross unrealized loss on equity securities was $459
million. Of the remainder, $5.692 billion represents fixed-income
investments that have been in a gross unrealized loss position for less than a
year and, of these, 97% are rated investment grade; $3.263 billion represents
fixed income investments that have been in a gross unrealized loss position
for a year or more and, of these, 91% are rated investment grade.
Available-for-sale mortgage-backed securities portfolio fair value balance
of $29.868 billion consists of $23.727 billion of government-sponsored
agencies securities, and $6.141 billion of privately sponsored securities of
which the majority is backed by mortgages that are not Alt-A or subprime.
This balance decreased from $63.075 billion as of December 31, 2007, or
$33.207 billion, due to unrealized losses, pay-downs received, and the
reclassification of Alt-A and non-agency securities from available-for-sale to
held-to-maturity investments.
The increase in gross unrealized losses on mortgage-backed securities was
primarily related to a widening of market spreads, reflecting an increase in
risk/liquidity premiums. The increase in gross unrealized losses on state and
municipal debt securities during 2008 was a result of market disruption,
causing reduced liquidity and an increase in municipal bond yields. For
these securities, management has asserted significant holding periods that in
certain cases now approach maturity of the securities.
As discussed in more detail below, the Company conducts and documents
periodic reviews of all securities with unrealized losses to evaluate whether
the impairment is other than temporary, pursuant to FASB Staff Position
No. 115-1, The Meaning of Other-Than-Temporary Impairment and Its
Application to Certain Investments (FSP FAS 115-1). Any unrealized loss
identified as other than temporary is recorded directly in the Consolidated
Statement of Income.
158