Citibank 2008 Annual Report Download - page 34
Download and view the complete annual report
Please find page 34 of the 2008 Citibank annual report below. You can navigate through the pages in the report by either clicking on the pages listed below, or by using the keyword search tool below to find specific information within the annual report.-
 1
1 -
2
-
3
-
4
-
5
-
6
-
7
-
8
-
9
-
10
-
11
-
12
-
13
-
14
-
15
-
16
-
17
-
18
-
19
-
20
-
21
-
22
-
23
-
 24
24 -
 25
25 -
 26
26 -
 27
27 -
 28
28 -
 29
29 -
 30
30 -
 31
31 -
 32
32 -
 33
33 -
 34
34 -
 35
35 -
 36
36 -
 37
37 -
 38
38 -
 39
39 -
 40
40 -
 41
41 -
 42
42 -
 43
43 -
 44
44 -
45
-
46
-
47
-
48
-
49
-
50
-
51
-
52
-
53
-
54
-
55
-
56
-
57
-
58
-
59
-
60
-
61
-
62
-
63
-
64
-
65
-
66
-
67
-
68
-
69
-
70
-
71
-
72
-
73
-
74
-
75
-
76
-
77
-
78
-
79
-
80
-
81
-
82
-
83
-
84
-
85
-
86
-
87
-
88
-
89
-
90
-
91
-
92
-
93
-
94
-
95
-
96
-
97
-
98
-
99
-
100
-
101
-
102
-
103
-
104
-
105
-
106
-
107
-
108
-
109
-
110
-
111
-
112
-
113
-
114
-
115
-
116
-
117
-
118
-
119
-
120
-
121
-
122
-
123
-
124
-
125
-
126
-
127
-
128
-
129
-
130
-
131
-
132
-
133
-
134
-
135
-
136
-
137
-
138
-
139
-
140
-
141
-
142
-
143
-
144
-
145
-
146
-
147
-
148
-
149
-
150
-
151
-
152
-
153
-
154
-
155
-
156
-
157
-
158
-
159
-
160
-
161
-
162
-
163
-
164
-
165
-
166
-
167
-
168
-
169
-
170
-
171
-
172
-
173
-
174
-
175
-
176
-
177
-
178
-
179
-
180
-
181
-
182
-
183
-
184
-
185
-
186
-
187
-
188
-
189
-
190
-
191
-
192
-
193
-
194
-
195
-
196
-
197
-
198
-
199
-
200
-
201
-
202
-
203
-
204
-
205
-
206
-
207
-
208
-
209
-
210
-
211
-
212
-
213
-
214
-
215
-
216
-
217
-
218
-
219
-
220
-
221
-
222
-
223
-
224
-
225
-
226
-
227
-
228
-
229
-
230
-
231
-
232
-
233
-
234
-
235
-
236
-
237
-
238
-
239
-
240
-
241
-
242
-
243
-
244
-
245
-
246
-
247
-
248
-
249
-
250
-
251
-
252
 |
 |

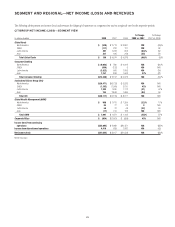
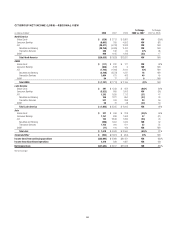
CITIGROUP REVENUES—REGIONAL VIEW
In millions of dollars 2008 2007 2006
% Change
2008 vs. 2007
% Change
2007 vs. 2006
North America
Global Cards $ 10,299 $13,893 $13,905 (26)% —
Consumer Banking 16,627 16,991 15,526 (2) 9%
ICG (22,477) (3,040) 13,032 NM NM
Securities and Banking (24,585) (4,663) 11,742 NM NM
Transaction Services 2,108 1,623 1,290 30 26
GWM 9,295 9,790 8,790 (5) 11
Total North America $ 13,744 $37,634 $51,253 (63)% (27)%
EMEA
Global Cards $ 2,326 $ 1,955 $ 1,205 19% 62%
Consumer Banking 2,596 2,485 2,059 421
ICG 5,592 4,235 8,758 32 (52)
Securities and Banking 2,222 1,454 6,611 53 (78)
Transaction Services 3,370 2,781 2,147 21 30
GWM 604 543 331 11 64
Total EMEA $ 11,118 $ 9,218 $12,353 21% (25)%
Latin America
Global Cards $ 5,017 $ 4,803 $ 2,726 4% 76%
Consumer Banking 3,959 4,185 3,740 (5) 12
ICG 3,812 4,206 3,091 (9) 36
Securities and Banking 2,411 3,078 2,251 (22) 37
Transaction Services 1,401 1,128 840 24 34
GWM 357 373 318 (4) 17
Total Latin America $ 13,145 $13,567 $ 9,875 (3)% 37%
Asia
Global Cards $ 2,565 $ 2,400 $ 1,976 7% 21%
Consumer Banking 5,470 5,797 5,310 (6) 9
ICG 5,256 8,339 5,766 (37) 45
Securities and Banking 2,515 6,006 4,047 (58) 48
Transaction Services 2,741 2,333 1,719 17 36
GWM 2,345 2,292 738 2NM
Total Asia $ 15,636 $18,828 $13,790 (17)% 37%
Corporate/Other $ (850) $ (752) $ (944) (13)% 20%
Total net revenue $ 52,793 $78,495 $86,327 (33)% (9)%
NM Not meaningful
28