Citibank 2008 Annual Report Download - page 36
Download and view the complete annual report
Please find page 36 of the 2008 Citibank annual report below. You can navigate through the pages in the report by either clicking on the pages listed below, or by using the keyword search tool below to find specific information within the annual report.-
 1
1 -
2
-
3
-
4
-
5
-
6
-
7
-
8
-
9
-
10
-
11
-
12
-
13
-
14
-
15
-
16
-
17
-
18
-
19
-
20
-
21
-
22
-
23
-
24
-
25
-
 26
26 -
 27
27 -
 28
28 -
 29
29 -
 30
30 -
 31
31 -
 32
32 -
 33
33 -
 34
34 -
 35
35 -
 36
36 -
 37
37 -
 38
38 -
 39
39 -
 40
40 -
 41
41 -
 42
42 -
 43
43 -
 44
44 -
 45
45 -
 46
46 -
47
-
48
-
49
-
50
-
51
-
52
-
53
-
54
-
55
-
56
-
57
-
58
-
59
-
60
-
61
-
62
-
63
-
64
-
65
-
66
-
67
-
68
-
69
-
70
-
71
-
72
-
73
-
74
-
75
-
76
-
77
-
78
-
79
-
80
-
81
-
82
-
83
-
84
-
85
-
86
-
87
-
88
-
89
-
90
-
91
-
92
-
93
-
94
-
95
-
96
-
97
-
98
-
99
-
100
-
101
-
102
-
103
-
104
-
105
-
106
-
107
-
108
-
109
-
110
-
111
-
112
-
113
-
114
-
115
-
116
-
117
-
118
-
119
-
120
-
121
-
122
-
123
-
124
-
125
-
126
-
127
-
128
-
129
-
130
-
131
-
132
-
133
-
134
-
135
-
136
-
137
-
138
-
139
-
140
-
141
-
142
-
143
-
144
-
145
-
146
-
147
-
148
-
149
-
150
-
151
-
152
-
153
-
154
-
155
-
156
-
157
-
158
-
159
-
160
-
161
-
162
-
163
-
164
-
165
-
166
-
167
-
168
-
169
-
170
-
171
-
172
-
173
-
174
-
175
-
176
-
177
-
178
-
179
-
180
-
181
-
182
-
183
-
184
-
185
-
186
-
187
-
188
-
189
-
190
-
191
-
192
-
193
-
194
-
195
-
196
-
197
-
198
-
199
-
200
-
201
-
202
-
203
-
204
-
205
-
206
-
207
-
208
-
209
-
210
-
211
-
212
-
213
-
214
-
215
-
216
-
217
-
218
-
219
-
220
-
221
-
222
-
223
-
224
-
225
-
226
-
227
-
228
-
229
-
230
-
231
-
232
-
233
-
234
-
235
-
236
-
237
-
238
-
239
-
240
-
241
-
242
-
243
-
244
-
245
-
246
-
247
-
248
-
249
-
250
-
251
-
252
 |
 |
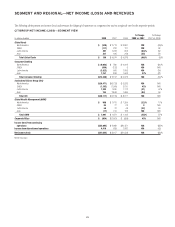
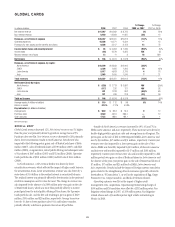
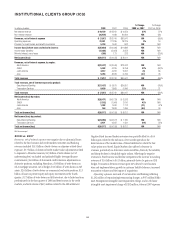
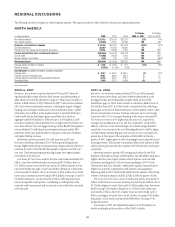
Provisions for credit losses and for benefits and claims increased $4.0
billion reflecting an increase of $2.0 billion in net credit losses and $2.0
billion in loan loss reserve builds. In North America, credit costs increased
$1.9 billion, driven by higher net credit losses, up $916 million or 44%, and a
higher loan loss reserve build, up $936 million. Higher credit costs reflected a
weakening of leading credit indicators, trends in the macro-economic
environment, including the housing market downturn, rising
unemployment trends, higher bankruptcy filings, and the continued
acceleration in the rate at which delinquent customers advanced to write-off.
A net charge to increase loan loss reserves related to an increase in reported
receivables as maturing securitizations resulted in on-balance sheet funding,
and also higher business volumes.
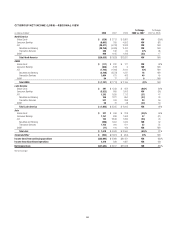
Outside of North America, credit costs increased by $605 million, $1,240
million and $322 million in EMEA,Latin America and Asia, respectively.
These increases were driven by higher net credit losses, which were up $324
million, $657 million and $144 million in EMEA,Latin America and Asia,
respectively. Higher net credit losses were driven by Mexico, Brazil and India,
as well as the impact of acquisitions. Also contributing to the increase were
higher loan loss reserve builds, which were up $281 million, $583 million
and $178 million in EMEA,Latin America and Asia, respectively, and higher
business volumes.
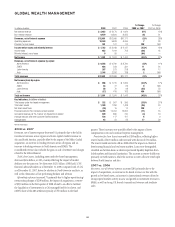
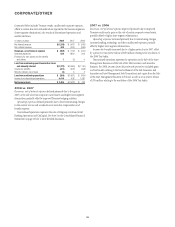
2007 vs. 2006
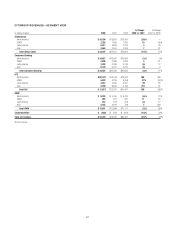
Total Global Cards revenue increased 16%. Net interest revenue was 22%
higher than the prior year primarily driven by growth of 12% in both average
loans and purchase sales. Non-interest revenue increased by 12% primarily
due to a $729 million pretax gain on Redecard shares, a pretax gain on the
sale of Visa International Inc. shares of $447 million and a pretax gain on
the sale of MasterCard shares of $458 million in 2007. This increase was
partially offset by lower securitization revenues primarily reflecting the net
impact of higher funding costs and higher credit losses in the securitization
trusts.
In North America, revenues were flat reflecting a pretax gain on the sale
of MasterCard shares of $393 million in 2007, offset by lower securitization
revenues. Purchase sales were up 6% and average loans were down 7%.
Outside of North America, revenues increased by 62%, 76% and 21% in
EMEA,Latin America and Asia, respectively. These increases include the
impact of pretax gains of $729 million on the sale of Redecard shares, $447
million on the sale of Visa International Inc. shares and $65 million on the
sale of MasterCard shares. Purchase sales and average loans were up 33%
and 46%, respectively. Results also include the impact of FX translation and
acquisitions.
Operating expenses were up 13% driven by a Visa litigation-related pretax
charge of $292 million, higher business volumes, credit management costs,
the impact of acquisitions, the integration of the CrediCard portfolio, and
repositioning charges. Expense growth in 2007 was favorably impacted by
the absence of the charge related to the initial adoption of SFAS 123(R) in
2006. Results also include the impact of FX translation.
Provisions for credit losses and for benefits and claims increased $2.4
billion reflecting an increase of $0.7 billion in net credit losses and $1.7
billion in loan loss reserve builds primarily reflecting a weakening of leading
credit indicators, a downturn in other economic trends including
unemployment and GDP affecting all other portfolios, and a change in
estimate of loan losses inherent in the portfolio but not yet visible in
delinquency statistics. In North America, credit costs increased $1.4 billion,
driven by a higher loan loss reserve build, up $1.3 billion, and higher net
credit losses, up $0.1 billion. The increase in provision for loan losses also
reflects the absence of loan loss reserve releases recorded in the prior year, as
well as an increase in bankruptcy filings in 2007 versus unusually low filing
levels experienced in 2006.
Outside of North America, credit costs increased by $203 million, $616
million and $121 million in EMEA,Latin America and Asia, respectively.
These increases were driven by higher business volumes, as well as higher
net credit losses, which were up $34 million, $473 million and $32 million
in EMEA,Latin America and Asia, respectively. Also contributing to the
increase were higher loan loss reserve builds, which were up $168 million,
$143 million and $89 million in EMEA,Latin America and Asia,
respectively. Provisions for loan losses and for benefits and claims
increased substantially, including a change in estimate of loan losses
inherent in the loan portfolio but not yet visible in delinquency statistics,
along with volume growth and credit deterioration in certain countries.
Higher past-due accounts in Mexico cards and the integration of the
CrediCard portfolio also contributed to the increase.
Net income was also affected by the absence of a prior-year $153 million
tax benefit resulting from the resolution of a federal tax audit.
OUTLOOK FOR 2009
During 2009, Citigroup’s credit card businesses are expected to experience
continued challenging economic and credit conditions. The weak global
economy, coupled with higher unemployment and bankruptcy filings, is
expected to have an adverse effect on credit quality with increases expected in
both delinquencies and credit losses. See “Outlook for 2009” on page 7 and
“Risk Factors” on page 47.
During 2009, Citigroup intends to continue to focus on offering credit and
payment solutions to consumers and small businesses globally by leveraging
its global distribution network locally. Citigroup is also taking appropriate
repricing actions that reflect the changing credit situation. In addition,
Citigroup’s management and reporting realignment will result in the
restructuring of these businesses, effective for reporting purposes in the
second quarter of 2009, to enable the Company to focus on driving the
performance of its core cards business (branded cards) and realize value
from the non-core cards businesses (private label cards).
The Company also anticipates deploying TARP funds received from the
U.S. government to offer special credit card programs that include expanded
eligibility for balance-consolidation offers, targeted increases in credit lines
and targeted new account originations. See “TARP and Other Regulatory
Programs – Implementation and Management of TARP Programs”
on page 44.
30