Citibank 2008 Annual Report Download - page 110
Download and view the complete annual report
Please find page 110 of the 2008 Citibank annual report below. You can navigate through the pages in the report by either clicking on the pages listed below, or by using the keyword search tool below to find specific information within the annual report.-
 1
1 -
2
-
3
-
4
-
5
-
6
-
7
-
8
-
9
-
10
-
11
-
12
-
13
-
14
-
15
-
16
-
17
-
18
-
19
-
20
-
21
-
22
-
23
-
24
-
25
-
26
-
27
-
28
-
29
-
30
-
31
-
32
-
33
-
34
-
35
-
36
-
37
-
38
-
39
-
40
-
41
-
42
-
43
-
44
-
45
-
46
-
47
-
48
-
49
-
50
-
51
-
52
-
53
-
54
-
55
-
56
-
57
-
58
-
59
-
60
-
61
-
62
-
63
-
64
-
65
-
66
-
67
-
68
-
69
-
70
-
71
-
72
-
73
-
74
-
75
-
76
-
77
-
78
-
79
-
80
-
81
-
82
-
83
-
84
-
85
-
86
-
87
-
88
-
89
-
90
-
91
-
92
-
93
-
94
-
95
-
96
-
97
-
98
-
99
-
 100
100 -
 101
101 -
 102
102 -
 103
103 -
 104
104 -
 105
105 -
 106
106 -
 107
107 -
 108
108 -
 109
109 -
 110
110 -
 111
111 -
 112
112 -
 113
113 -
 114
114 -
 115
115 -
 116
116 -
 117
117 -
 118
118 -
 119
119 -
 120
120 -
121
-
122
-
123
-
124
-
125
-
126
-
127
-
128
-
129
-
130
-
131
-
132
-
133
-
134
-
135
-
136
-
137
-
138
-
139
-
140
-
141
-
142
-
143
-
144
-
145
-
146
-
147
-
148
-
149
-
150
-
151
-
152
-
153
-
154
-
155
-
156
-
157
-
158
-
159
-
160
-
161
-
162
-
163
-
164
-
165
-
166
-
167
-
168
-
169
-
170
-
171
-
172
-
173
-
174
-
175
-
176
-
177
-
178
-
179
-
180
-
181
-
182
-
183
-
184
-
185
-
186
-
187
-
188
-
189
-
190
-
191
-
192
-
193
-
194
-
195
-
196
-
197
-
198
-
199
-
200
-
201
-
202
-
203
-
204
-
205
-
206
-
207
-
208
-
209
-
210
-
211
-
212
-
213
-
214
-
215
-
216
-
217
-
218
-
219
-
220
-
221
-
222
-
223
-
224
-
225
-
226
-
227
-
228
-
229
-
230
-
231
-
232
-
233
-
234
-
235
-
236
-
237
-
238
-
239
-
240
-
241
-
242
-
243
-
244
-
245
-
246
-
247
-
248
-
249
-
250
-
251
-
252
 |
 |

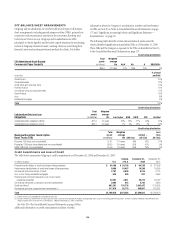
OFF-BALANCE-SHEET ARRANGEMENTS
Citigroup and its subsidiaries are involved with several types of off-balance
sheet arrangements, including special purpose entities (SPEs), primarily in
connection with securitization activities in the Consumer Banking and
Institutional Clients Group. Citigroup and its subsidiaries use SPEs
principally to obtain liquidity and favorable capital treatment by securitizing
certain of Citigroup’s financial assets, assisting clients in securitizing their
financial assets and creating investment products for clients. For further
information about the Company’s securitization activities and involvement
in SPEs, see Note 23 to Notes to Consolidated Financial Statements on page
175 and “Significant Accounting Policies and Significant Estimates—
Securitizations” on page 18.
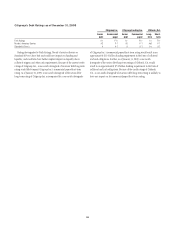
The following tables describe certain characteristics of assets owned by
certain identified significant unconsolidated VIEs as of December 31, 2008.
These VIEs and the Company’s exposure to the VIEs are described in Note 23
to the Consolidated Financial Statements on page 175.
Credit rating distribution
Citi-Administered Asset-Backed
Commercial Paper Conduits
Total
assets
(in billions)
Weighted
average
life AAA AA A BBB/BBB+
$59.6 4.2 years 41% 45% 10% 4%
Asset class
% of total
portfolio
Student loans 24%
Trade receivables 13%
Credit cards and consumer loans 10%
Portfolio finance 12%
Commercial loans and corporate credit 17%
Export finance 13%
Auto 8%
Residential mortgage 3%
Total 100%
Credit rating distribution
Collateralized Debt and Loan
Obligations
Total
assets
(in billions)
Weighted
average
life A or higher BBB BB/B CCC Unrated
Collateralized debt obligations (CDOs) $17.6 4.5 years 23% 13% 11% 34% 19%
Collateralized loan obligations (CLOs) $20.1 5.9 years 1% 3% 45% 1% 50%
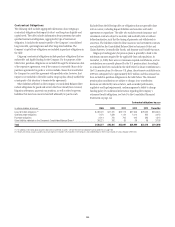
Credit rating distribution
Municipal Securities Tender Option
Bond Trusts (TOB)
Total
assets
(in billions)
Weighted
average
life AAA/Aaa
AA/Aa1 –
AA-/Aa3
Less
than
AA-/Aa3
Customer TOB trusts (not consolidated) $ 8.1 11.4 years 48% 42% 10%
Proprietary TOB trusts (consolidated and non-consolidated) $15.5 19.0 years 50% 41% 9%
QSPE TOB trusts (not consolidated) $ 6.5 9.0 years 62% 29% 9%
Credit Commitments and Lines of Credit
The table below summarizes Citigroup’s credit commitments as of December 31, 2008 and December 31, 2007:
In millions of dollars U.S.
Outside
of U.S.
December 31,
2008
December 31,
2007
Financial standby letters of credit and foreign office guarantees $ 68,100 $ 26,136 $ 94,236 $ 87,066
Performance standby letters of credit and foreign office guarantees 5,809 10,487 16,296 18,055
Commercial and similar letters of credit 2,187 6,028 8,215 9,175
One- to four-family residential mortgages 628 309 937 4,587
Revolving open-end loans secured by one- to four-family
residential properties 22,591 2,621 25,212 35,187
Commercial real estate, construction and land development 2,084 618 2,702 4,834
Credit card lines (1) 867,261 135,176 1,002,437 1,103,535
Commercial and other consumer loan commitments (2) 217,818 92,179 309,997 473,631
Total $1,186,478 $273,554 $1,460,032 $1,736,070
(1) Credit card lines are unconditionally cancelable by the issuer.
(2) Includes commercial commitments to make or purchase loans, to purchase third-party receivables, and to provide note issuance or revolving underwriting facilities. Amounts include $140 billion and $259 billion with
original maturity of less than one year at December 31, 2008 and December 31, 2007, respectively.
See Note 29 to the Consolidated Financial Statements on page 208 for
additional information on credit commitments and lines of credit.
104