Citibank 2008 Annual Report Download - page 69
Download and view the complete annual report
Please find page 69 of the 2008 Citibank annual report below. You can navigate through the pages in the report by either clicking on the pages listed below, or by using the keyword search tool below to find specific information within the annual report.-
 1
1 -
2
-
3
-
4
-
5
-
6
-
7
-
8
-
9
-
10
-
11
-
12
-
13
-
14
-
15
-
16
-
17
-
18
-
19
-
20
-
21
-
22
-
23
-
24
-
25
-
26
-
27
-
28
-
29
-
30
-
31
-
32
-
33
-
34
-
35
-
36
-
37
-
38
-
39
-
40
-
41
-
42
-
43
-
44
-
45
-
46
-
47
-
48
-
49
-
50
-
51
-
52
-
53
-
54
-
55
-
56
-
57
-
58
-
 59
59 -
 60
60 -
 61
61 -
 62
62 -
 63
63 -
 64
64 -
 65
65 -
 66
66 -
 67
67 -
 68
68 -
 69
69 -
 70
70 -
 71
71 -
 72
72 -
 73
73 -
 74
74 -
 75
75 -
 76
76 -
 77
77 -
 78
78 -
 79
79 -
80
-
81
-
82
-
83
-
84
-
85
-
86
-
87
-
88
-
89
-
90
-
91
-
92
-
93
-
94
-
95
-
96
-
97
-
98
-
99
-
100
-
101
-
102
-
103
-
104
-
105
-
106
-
107
-
108
-
109
-
110
-
111
-
112
-
113
-
114
-
115
-
116
-
117
-
118
-
119
-
120
-
121
-
122
-
123
-
124
-
125
-
126
-
127
-
128
-
129
-
130
-
131
-
132
-
133
-
134
-
135
-
136
-
137
-
138
-
139
-
140
-
141
-
142
-
143
-
144
-
145
-
146
-
147
-
148
-
149
-
150
-
151
-
152
-
153
-
154
-
155
-
156
-
157
-
158
-
159
-
160
-
161
-
162
-
163
-
164
-
165
-
166
-
167
-
168
-
169
-
170
-
171
-
172
-
173
-
174
-
175
-
176
-
177
-
178
-
179
-
180
-
181
-
182
-
183
-
184
-
185
-
186
-
187
-
188
-
189
-
190
-
191
-
192
-
193
-
194
-
195
-
196
-
197
-
198
-
199
-
200
-
201
-
202
-
203
-
204
-
205
-
206
-
207
-
208
-
209
-
210
-
211
-
212
-
213
-
214
-
215
-
216
-
217
-
218
-
219
-
220
-
221
-
222
-
223
-
224
-
225
-
226
-
227
-
228
-
229
-
230
-
231
-
232
-
233
-
234
-
235
-
236
-
237
-
238
-
239
-
240
-
241
-
242
-
243
-
244
-
245
-
246
-
247
-
248
-
249
-
250
-
251
-
252
 |
 |

Second, the Company continues to evaluate each of its portfolios to
identify those customers who might be eligible to refinance or modify their
mortgages and stay in their homes, offering them different solutions. The
Citi Homeowner Assistance program is an example of such efforts,
preemptively reaching out to homeowners not currently behind on their
mortgage payments, but that may require help to remain current on their
mortgages. These efforts focus particularly on borrowers in geographies
facing extreme economic distress.
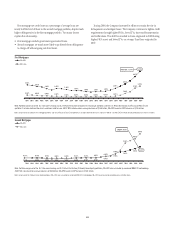
Third, the Company has initiated various mortgage foreclosure
moratoriums. See “Citigroup Mortgage Foreclosure Moratoriums” on page
59.
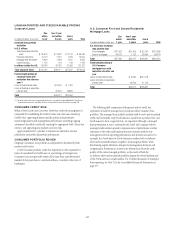
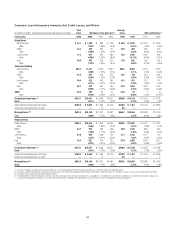
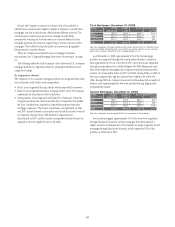
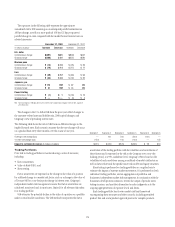
The following tables detail the Company’s first and second U.S. Consumer
mortgage portfolio by origination channels, geographic distribution and
origination vintage.
By Origination Channel
The Company’s U.S. Consumer mortgage portfolio was originated from three
main channels: retail, broker and correspondent.
• Retail: loans originated through a direct relationship with the borrower.
• Broker: loans originated through a mortgage broker, where the Company
underwrites the loan directly with the borrower.
• Correspondent: loans originated and funded by a third party, where the
Company purchases the closed loans after the correspondent has funded
the loan. Includes loans acquired in large bulk purchases from other
mortgage originators. These types of purchases, used primarily in 2006
and 2007, mainly focused on non-prime and second-lien loans to be held
on Citigroup’s balance sheet. This method of acquisition was
discontinued in 2007, and the current correspondent channel focuses on
acquisition of loans eligible for sale to the GSEs.
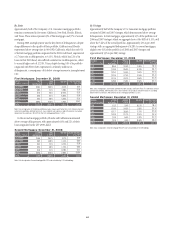
First Mortgages: December 31, 2008
RETAIL
CHANNEL
(in billions of dollars)
BROKER
TOTAL
CORRESPONDENT
90+DPD
2.48%
5.23%
8.79%
5.66%
FIRST MORTGAGES
FICO<620
$11.5
$1.5
$9.3
$22.4
CHANNEL
% TOTAL
39.8%
17.4%
42.8%
100.0%
FIRST
MORTGAGES
$53.4
$23.3
$57.3
$133.9
Note: Data at origination. $134 billion portfolio excludes Canada and Puerto Rico, First Collateral Services
(commercial portfolio), deferred fees/costs, loans held-for-sale and loans sold with recourse. Excluding
Government insured loans, 90+DPD for the first mortgage portfolio is 5.13%.
As of December 31, 2008, approximately 43% of the first mortgage
portfolio was originated through the correspondent channel, a reduction
from approximately 47% as of the end of 2007. Given that loans originated
through correspondents have exhibited higher 90+DPD delinquency rates
than retail originated mortgages, the Company terminated business with a
number of correspondent sellers in 2007 and 2008. During 2008, over 96% of
the loans originated through this channel were eligible to be sold to the
GSEs. During 2008, the Company has severed relationships with a number of
brokers, only maintaining those who have produced strong, high-quality
and profitable volume.
Second Mortgages: December 31, 2008
RETAIL
CHANNEL
(in billions of dollars)
BROKER
TOTAL
CORRESPONDENT
90+DPD
0.91%
3.24%
4.03%
2.39%
SECOND MORTGAGES
LTV 90%
$2.2
$4.0
$11.0
$17.2
CHANNEL
% TOTAL
45.6%
27.8%
26.6%
100.0%
SECOND
MORTGAGES
$26.9
$16.4
$15.7
$59.0
Note: Data at origination. Second mortgage 90+DPD rate calculated by OTS methodology.
For second mortgages, approximately 54% of the loans were originated
through third-party channels. As these mortgages have demonstrated a
higher incidence of delinquencies, the Company no longer originates second
mortgages through third-party channels, which represented 59% of the
portfolio as of the end of 2007.
63