Citibank 2008 Annual Report Download - page 42
Download and view the complete annual report
Please find page 42 of the 2008 Citibank annual report below. You can navigate through the pages in the report by either clicking on the pages listed below, or by using the keyword search tool below to find specific information within the annual report.-
 1
1 -
2
-
3
-
4
-
5
-
6
-
7
-
8
-
9
-
10
-
11
-
12
-
13
-
14
-
15
-
16
-
17
-
18
-
19
-
20
-
21
-
22
-
23
-
24
-
25
-
26
-
27
-
28
-
29
-
30
-
31
-
 32
32 -
 33
33 -
 34
34 -
 35
35 -
 36
36 -
 37
37 -
 38
38 -
 39
39 -
 40
40 -
 41
41 -
 42
42 -
 43
43 -
 44
44 -
 45
45 -
 46
46 -
 47
47 -
 48
48 -
 49
49 -
 50
50 -
 51
51 -
 52
52 -
53
-
54
-
55
-
56
-
57
-
58
-
59
-
60
-
61
-
62
-
63
-
64
-
65
-
66
-
67
-
68
-
69
-
70
-
71
-
72
-
73
-
74
-
75
-
76
-
77
-
78
-
79
-
80
-
81
-
82
-
83
-
84
-
85
-
86
-
87
-
88
-
89
-
90
-
91
-
92
-
93
-
94
-
95
-
96
-
97
-
98
-
99
-
100
-
101
-
102
-
103
-
104
-
105
-
106
-
107
-
108
-
109
-
110
-
111
-
112
-
113
-
114
-
115
-
116
-
117
-
118
-
119
-
120
-
121
-
122
-
123
-
124
-
125
-
126
-
127
-
128
-
129
-
130
-
131
-
132
-
133
-
134
-
135
-
136
-
137
-
138
-
139
-
140
-
141
-
142
-
143
-
144
-
145
-
146
-
147
-
148
-
149
-
150
-
151
-
152
-
153
-
154
-
155
-
156
-
157
-
158
-
159
-
160
-
161
-
162
-
163
-
164
-
165
-
166
-
167
-
168
-
169
-
170
-
171
-
172
-
173
-
174
-
175
-
176
-
177
-
178
-
179
-
180
-
181
-
182
-
183
-
184
-
185
-
186
-
187
-
188
-
189
-
190
-
191
-
192
-
193
-
194
-
195
-
196
-
197
-
198
-
199
-
200
-
201
-
202
-
203
-
204
-
205
-
206
-
207
-
208
-
209
-
210
-
211
-
212
-
213
-
214
-
215
-
216
-
217
-
218
-
219
-
220
-
221
-
222
-
223
-
224
-
225
-
226
-
227
-
228
-
229
-
230
-
231
-
232
-
233
-
234
-
235
-
236
-
237
-
238
-
239
-
240
-
241
-
242
-
243
-
244
-
245
-
246
-
247
-
248
-
249
-
250
-
251
-
252
 |
 |

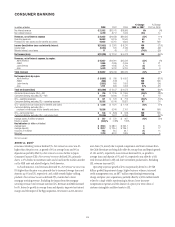
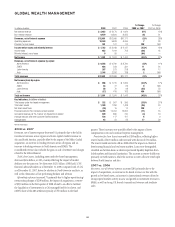
GLOBAL WEALTH MANAGEMENT
In millions of dollars 2008 2007 2006
% Change
2008 vs. 2007
% Change
2007 vs. 2006
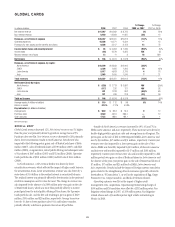
Net interest revenue $ 2,622 $ 2,174 $ 1,922 21% 13%
Non-interest revenue 9,979 10,824 8,255 (8) 31
Revenues, net of interest expense $12,601 $12,998 $10,177 (3)% 28%
Operating expenses 10,548 9,849 8,006 723
Provision for loan losses 301 101 24 NM NM
Income before taxes and minority interest $ 1,752 $ 3,048 $ 2,147 (43)% 42%
Income taxes 652 1,019 703 (36) 45
Minority interest, net of taxes 955 — (84) —
Net income $ 1,091 $ 1,974 $ 1,444 (45)% 37%
Revenues, net of interest expense by region:
North America $ 9,295 $ 9,790 $ 8,790 (5)% 11%
EMEA 604 543 331 11 64
Latin America 357 373 318 (4) 17
Asia 2,345 2,292 738 2NM
Total revenues $12,601 $12,998 $10,177 (3)% 28%
Net income (loss) by region:
North America $ 968 $ 1,415 $ 1,209 (32)% 17%
EMEA 84 77 23 9NM
Latin America 56 72 48 (22) 50
Asia (17) 410 163 NM NM
Total net income $ 1,091 $ 1,974 $ 1,443 (45)% 37%
Key indicators: (in billions of dollars)
Total assets under fee-based management $ 332 $ 507 $ 399 (35)% 27%
Total client assets 1,320 1,784 1,438 (26) 24
Net client asset flows (25) 15 14 NM 7
Financial advisors (FA) / bankers (actual number) 13,765 15,454 13,694 (11) 13
Annualized revenue per FA / banker (in thousands of dollars) 849 880 740 (4) 19
Average deposits and other customer liability balances 126 117 107 89
Average loans 63 54 42 17 29
NM Not meaningful.
2008 vs. 2007
Revenues, net of interest expense decreased 3% primarily due to the fall in
investment revenues across regions and lower capital markets revenue in
Asia and North America, partially offset by the impact of the Nikko Cordial
acquisition, an increase in lending revenues across all regions and an
increase in banking revenues in North America and EMEA. The
consolidated revenue also includes the gain on sale of CitiStreet and charges
related to the ARS settlement.
Total client assets, including assets under fee-based management,
decreased $464 billion, or 26%, mainly reflecting the impact of market
declines over the past year. Net flows were $(25) billion. GWM had 13,765
financial advisors/bankers as of December 31, 2008, compared with 15,454
as of December 31, 2007, driven by attrition in North America and Asia,as
well as the elimination of low performing bankers and advisors.
Operating expenses increased 7% primarily due to higher repositioning/
restructuring charges of $298 million, the impact of acquisitions, a reserve
of $250 million in the first quarter of 2008 related to an offer to facilitate
the liquidation of investments in a Citi-managed fund for its clients, and
GWM’s share of the ARS settlement penalty of $50 million in the third
quarter. These increases were partially offset by the impact of lower
compensation costs and continued expense management.
Provision for loan losses increased by $200 million, reflecting higher
reserve builds of $149 million and increased write-downs of $51 million.
The reserve builds and write-offs in 2008 reflect the impact on clients of
deteriorating financial and real estate markets. Loans were downgraded,
classified and written-down as clients experienced liquidity depletion from
failed markets and financial institutions. The increase in reserve builds was
primarily in North America, while the increase in write-offs were evenly split
between North America and Asia.
2007 vs. 2006
Revenues, net of interest expense increased 28% primarily due to the
impact of acquisitions, an increase in fee-based revenues in line with the
growth in fee-based assets, an increase in international revenues driven by
strong capital markets activity in Asia and growth in investment revenue in
EMEA, as well as strong U.S. branch transactional revenue and syndicate
sales.
36