Citibank 2008 Annual Report Download - page 101
Download and view the complete annual report
Please find page 101 of the 2008 Citibank annual report below. You can navigate through the pages in the report by either clicking on the pages listed below, or by using the keyword search tool below to find specific information within the annual report.-
 1
1 -
2
-
3
-
4
-
5
-
6
-
7
-
8
-
9
-
10
-
11
-
12
-
13
-
14
-
15
-
16
-
17
-
18
-
19
-
20
-
21
-
22
-
23
-
24
-
25
-
26
-
27
-
28
-
29
-
30
-
31
-
32
-
33
-
34
-
35
-
36
-
37
-
38
-
39
-
40
-
41
-
42
-
43
-
44
-
45
-
46
-
47
-
48
-
49
-
50
-
51
-
52
-
53
-
54
-
55
-
56
-
57
-
58
-
59
-
60
-
61
-
62
-
63
-
64
-
65
-
66
-
67
-
68
-
69
-
70
-
71
-
72
-
73
-
74
-
75
-
76
-
77
-
78
-
79
-
80
-
81
-
82
-
83
-
84
-
85
-
86
-
87
-
88
-
89
-
90
-
 91
91 -
 92
92 -
 93
93 -
 94
94 -
 95
95 -
 96
96 -
 97
97 -
 98
98 -
 99
99 -
 100
100 -
 101
101 -
 102
102 -
 103
103 -
 104
104 -
 105
105 -
 106
106 -
 107
107 -
 108
108 -
 109
109 -
 110
110 -
 111
111 -
112
-
113
-
114
-
115
-
116
-
117
-
118
-
119
-
120
-
121
-
122
-
123
-
124
-
125
-
126
-
127
-
128
-
129
-
130
-
131
-
132
-
133
-
134
-
135
-
136
-
137
-
138
-
139
-
140
-
141
-
142
-
143
-
144
-
145
-
146
-
147
-
148
-
149
-
150
-
151
-
152
-
153
-
154
-
155
-
156
-
157
-
158
-
159
-
160
-
161
-
162
-
163
-
164
-
165
-
166
-
167
-
168
-
169
-
170
-
171
-
172
-
173
-
174
-
175
-
176
-
177
-
178
-
179
-
180
-
181
-
182
-
183
-
184
-
185
-
186
-
187
-
188
-
189
-
190
-
191
-
192
-
193
-
194
-
195
-
196
-
197
-
198
-
199
-
200
-
201
-
202
-
203
-
204
-
205
-
206
-
207
-
208
-
209
-
210
-
211
-
212
-
213
-
214
-
215
-
216
-
217
-
218
-
219
-
220
-
221
-
222
-
223
-
224
-
225
-
226
-
227
-
228
-
229
-
230
-
231
-
232
-
233
-
234
-
235
-
236
-
237
-
238
-
239
-
240
-
241
-
242
-
243
-
244
-
245
-
246
-
247
-
248
-
249
-
250
-
251
-
252
 |
 |

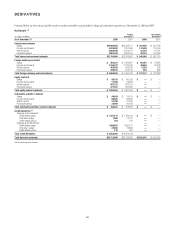
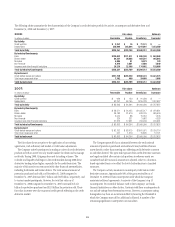
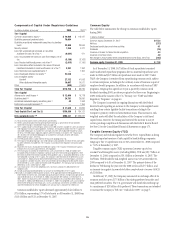
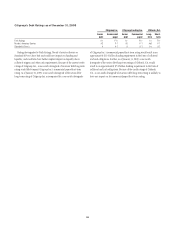
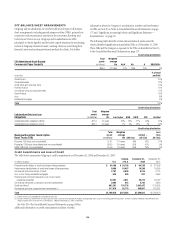
Components of Capital Under Regulatory Guidelines
In millions of dollars at year end 2008 2007 (1)
Tier 1 Capital
Common stockholders’ equity (2) $ 70,966 $ 113,447
Qualifying perpetual preferred stock 70,664 —
Qualifying mandatorily redeemable securities of subsidiary
trusts 23,899 23,594
Minority interest 1,268 4,077
Less: Net unrealized gains (losses) on securities
available-for-sale, net of tax (3) (9,647) 471
Less: Accumulated net losses on cash flow hedges, net of
tax (5,189) (3,163)
Less: Pension liability adjustment, net of tax (4) (2,615) (1,196)
Less: Cumulative effect included in fair value of financial
liabilities attributable to credit worthiness, net of tax (5) 3,391 1,352
Less: Restricted core capital elements (6) —1,364
Less: Disallowed deferred tax assets (7) 23,520 —
Less: Intangible assets:
Goodwill 27,132 41,053
Other disallowed intangible assets 10,607 10,511
Other (840) (1,500)
Total Tier 1 Capital $118,758 $ 89,226
Tier 2 Capital
Allowance for credit losses (8) $ 12,806 $ 15,778
Qualifying debt (9) 24,791 26,690
Unrealized marketable equity securities gains (3) 43 1,063
Restricted core capital elements (6) — 1,364
Total Tier 2 Capital $ 37,640 $ 44,895
Total Capital (Tier 1 and Tier 2) $156,398 $ 134,121
Risk-weighted assets (10) $996,247 $1,253,321
(1) Reclassified to conform to the current period’s presentation.
(2) Reflects prior period adjustment to opening retained earnings as presented in the Consolidated
Statement of Changes in Stockholders’ Equity on page 118.
(3) Tier 1 Capital excludes unrealized gains and losses on debt securities available-for-sale in accordance
with regulatory risk-based capital guidelines. Institutions are required to deduct from Tier 1 Capital net
unrealized holding gains on available-for-sale equity securities with readily determinable fair values,
net of tax. The federal bank regulatory agencies permit institutions to include in Tier 2 Capital up to
45% of pretax net unrealized holding gains on available-for-sale equity securities with readily
determinable fair values, net of tax.
(4) The FRB granted interim capital relief for the impact of adopting SFAS 158.
(5) The impact of including Citigroup’s own credit rating in valuing liabilities for which the fair value option
has been selected is excluded from Tier 1 Capital, in accordance with regulatory risk-based capital
guidelines.
(6) Represents the excess of allowable restricted core capital in Tier 1 Capital. Restricted core capital is
limited to 25% of all core capital elements, net of goodwill.
(7) Of the Company’s $44 billion of net deferred tax assets at December 31, 2008, $14 billion were
includable without limitation in regulatory capital pursuant to the risk-based capital guidelines, while
$24 billion exceeds the limitation imposed by these guidelines and as “disallowed deferred tax assets”
were deducted in arriving at Tier 1 Capital. The Company’s other $6 billion of net deferred tax assets
at December 31, 2008, primarily represented the deferred tax effects of unrealized gains and losses
on available-for-sale debt securities, which are permitted to be excluded prior to deriving the amount
of net deferred tax assets subject to limitation under the guidelines. The Company had no disallowed
deferred tax assets at December 31, 2007.
(8) Can include up to 1.25% of risk-weighted assets. Any excess allowance is deducted from risk-
weighted assets.
(9) Includes qualifying subordinated debt in an amount not exceeding 50% of Tier 1 Capital.
(10) Includes risk-weighted credit equivalent amounts, net of applicable bilateral netting agreements, of
$102.9 billion for interest rate, commodity and equity derivative contracts, foreign-exchange contracts
and credit derivatives as of December 31, 2008, compared with $91.3 billion as of December 31,
2007. Market-risk-equivalent assets included in risk-weighted assets amounted to $101.8 billion at
December 31, 2008 and $109.0 billion at December 31, 2007. Risk-weighted assets also include the
effect of other off-balance-sheet exposures, such as unused loan commitments and letters of credit,
and reflect deductions for certain intangible assets and any excess allowance for credit losses.
Common stockholders’ equity decreased approximately $42.4 billion to
$71.0 billion, representing 3.7% of total assets as of December 31, 2008 from
$113.4 billion and 5.2% at December 31, 2007.
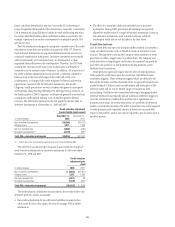
Common Equity
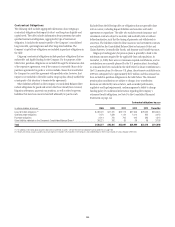
The table below summarizes the change in common stockholders’ equity
during 2008:
In billions of dollars
Common equity, December 31, 2007 $113.4
Net loss (27.7)
Employee benefit plans and other activities 4.1
Dividends (7.6)
Issuance of shares for Nikko Cordial acquisition 4.4
Issuance of common stock 4.9
Net change in Accumulated other comprehensive income (loss), net of tax (20.5)
Common equity, December 31, 2008 $ 71.0
As of December 31, 2008, $6.7 billion of stock repurchases remained
under authorized repurchase programs after no material repurchases were
made in 2008 and $0.7 billion of repurchases were made in 2007. Under
TARP, the Company is restricted from repurchasing common stock, subject
to certain exceptions, including in the ordinary course of business as part of
employee benefit programs. In addition, in accordance with various TARP
programs, Citigroup has agreed not to pay a quarterly common stock
dividend exceeding $0.01 per share per quarter for three years (beginning in
2009) without the consent of the U.S. Treasury. See “TARP and Other
Regulatory Programs” on page 44.
The Company is currently in ongoing discussions with the Federal
Reserve Board regarding an increase to the Company’s risk-weighted assets
resulting from certain liquidity-facility transactions relating to the
Company’s primary credit card securitization trusts. This increase in risk-
weighted assets will affect the calculation of the Company’s risk-based
capital ratios. However, the timing and extent of the increase is not yet
certain, pending completion of discussions with the Federal Reserve Board.
See Note 23 to the Consolidated Financial Statements on page 175.
Tangible Common Equity (TCE)
The Company and its bank regulators view the Tier 1 Capital Ratio as being
the most important measure of risk capital for bank holding companies.
Citigroup’s Tier 1 Capital Ratio was 11.92% at December 31, 2008 compared
to 7.12% at December 31, 2007.
Tangible common equity (TCE) represents Common equity less
Goodwill and Intangible assets (excluding MSRs). TCE was $29.7 billion at
December 31, 2008, compared to $58.1 billion at December 31, 2007. The
TCE Ratio (TCE divided by risk-weighted assets) was 3.0% at December 31,
2008 compared to 4.6% at December 31, 2007. The primary drivers of the
decline in TCE during the year were the 2008 net loss of $27.7 billion, and
an increase in negative Accumulated other comprehensive income (AOCI)
of $21 billion.
On February 27, 2009, the Company announced an exchange offer of its
common stock for up to $27.5 billion of its existing preferred securities and
trust preferred securities. The U.S. government will match this exchange up
to a maximum of $25 billion of its preferred. These transactions are intended
to increase the Company’s TCE. See “Outlook for 2009” on page 7.
95