Citibank 2008 Annual Report Download - page 112
Download and view the complete annual report
Please find page 112 of the 2008 Citibank annual report below. You can navigate through the pages in the report by either clicking on the pages listed below, or by using the keyword search tool below to find specific information within the annual report.-
 1
1 -
2
-
3
-
4
-
5
-
6
-
7
-
8
-
9
-
10
-
11
-
12
-
13
-
14
-
15
-
16
-
17
-
18
-
19
-
20
-
21
-
22
-
23
-
24
-
25
-
26
-
27
-
28
-
29
-
30
-
31
-
32
-
33
-
34
-
35
-
36
-
37
-
38
-
39
-
40
-
41
-
42
-
43
-
44
-
45
-
46
-
47
-
48
-
49
-
50
-
51
-
52
-
53
-
54
-
55
-
56
-
57
-
58
-
59
-
60
-
61
-
62
-
63
-
64
-
65
-
66
-
67
-
68
-
69
-
70
-
71
-
72
-
73
-
74
-
75
-
76
-
77
-
78
-
79
-
80
-
81
-
82
-
83
-
84
-
85
-
86
-
87
-
88
-
89
-
90
-
91
-
92
-
93
-
94
-
95
-
96
-
97
-
98
-
99
-
100
-
101
-
 102
102 -
 103
103 -
 104
104 -
 105
105 -
 106
106 -
 107
107 -
 108
108 -
 109
109 -
 110
110 -
 111
111 -
 112
112 -
 113
113 -
 114
114 -
 115
115 -
 116
116 -
 117
117 -
 118
118 -
 119
119 -
 120
120 -
 121
121 -
 122
122 -
123
-
124
-
125
-
126
-
127
-
128
-
129
-
130
-
131
-
132
-
133
-
134
-
135
-
136
-
137
-
138
-
139
-
140
-
141
-
142
-
143
-
144
-
145
-
146
-
147
-
148
-
149
-
150
-
151
-
152
-
153
-
154
-
155
-
156
-
157
-
158
-
159
-
160
-
161
-
162
-
163
-
164
-
165
-
166
-
167
-
168
-
169
-
170
-
171
-
172
-
173
-
174
-
175
-
176
-
177
-
178
-
179
-
180
-
181
-
182
-
183
-
184
-
185
-
186
-
187
-
188
-
189
-
190
-
191
-
192
-
193
-
194
-
195
-
196
-
197
-
198
-
199
-
200
-
201
-
202
-
203
-
204
-
205
-
206
-
207
-
208
-
209
-
210
-
211
-
212
-
213
-
214
-
215
-
216
-
217
-
218
-
219
-
220
-
221
-
222
-
223
-
224
-
225
-
226
-
227
-
228
-
229
-
230
-
231
-
232
-
233
-
234
-
235
-
236
-
237
-
238
-
239
-
240
-
241
-
242
-
243
-
244
-
245
-
246
-
247
-
248
-
249
-
250
-
251
-
252
 |
 |

PENSION AND POSTRETIREMENT PLANS
The Company has several non-contributory defined benefit pension plans
covering substantially all U.S. employees and has various defined benefit
pension and termination indemnity plans covering employees outside the
United States. The U.S. defined benefit plan provides benefits under a cash
balance formula. Employees satisfying certain age and service requirements
remain covered by a prior final pay formula. The Company also offers
postretirement health care and life insurance benefits to certain eligible U.S.
retired employees, as well as to certain eligible employees outside the United
States.
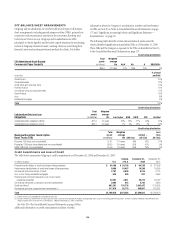
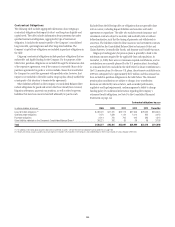
The following table shows the pension (benefit) expense and
contributions for Citigroup’s plans:
U.S. plans Non-U.S. plans
In millions of dollars 2008 2007 2006 2008 2007 2006
Pension (benefit) expense (1)(2) $(160) $179 $182 $205 $123 $115
Company
contributions (3) ———286 223 382
(1) The 2008 expense includes a $23 million curtailment loss for the U.S. plans and $22 million for the
non-U.S. plans recognized in the fourth quarter relating to the Company’s restructuring actions.
(2) The 2006 expense for the U.S. plans includes an $80 million curtailment gain recognized as of
September 30, 2006 relating to the Company’s decision to freeze benefit accruals for all cash-balance
participants after 2007.
(3) In addition, the Company absorbed $13 million, $15 million and $20 million during 2008, 2007 and
2006, respectively, relating to certain investment management fees and administration costs for the
U.S. plans, which are excluded from this table.
The following table shows the combined postretirement expense and
contributions for Citigroup’s U.S. and foreign plans:
U.S. and non-U.S. plans
In millions of dollars 2008 2007 2006
Postretirement expense (1) $115 $69 $ 71
Company contributions 103 72 260
(1) The 2008 expense includes a $6 million curtailment loss related to the Company’s fourth-quarter
restructuring actions.
Expected Rate of Return
Citigroup determines its assumptions for the expected rate of return on plan
assets for its U.S. pension and postretirement plans using a “building block”
approach, which focuses on ranges of anticipated rates of return for each
asset class. A weighted range of nominal rates is then determined based on
target allocations to each asset class. Citigroup considers the expected rate of
return to be a long-term assessment of return expectations and does not
anticipate changing this assumption annually unless there are significant
changes in investment strategy or economic conditions. This contrasts with
the selection of the discount rate, future compensation increase rate, and
certain other assumptions, which are reconsidered annually in accordance
with generally accepted accounting principles.
The expected rate of return for the U.S. pension and post-retirement plans
was 7.75% at December 31, 2008 and 8.0% at December 31, 2007 and 2006,
reflecting the performance of the global capital markets. Actual returns in
2008 were less than the expected returns, while actual returns in 2007 and
2006 were more than the expected returns. This expected amount reflects the
expected annual appreciation of the plan assets and reduces the annual
pension expense of the Company. It is deducted from the sum of service cost,
interest and other components of pension expense to arrive at the net
pension (benefit) expense. Net pension (benefit) expense for the U.S. pension
plans for 2008, 2007 and 2006 reflects deductions of $949, $889 million and
$845 million of expected returns, respectively.
106