Citibank 2008 Annual Report Download - page 151
Download and view the complete annual report
Please find page 151 of the 2008 Citibank annual report below. You can navigate through the pages in the report by either clicking on the pages listed below, or by using the keyword search tool below to find specific information within the annual report.-
 1
1 -
2
-
3
-
4
-
5
-
6
-
7
-
8
-
9
-
10
-
11
-
12
-
13
-
14
-
15
-
16
-
17
-
18
-
19
-
20
-
21
-
22
-
23
-
24
-
25
-
26
-
27
-
28
-
29
-
30
-
31
-
32
-
33
-
34
-
35
-
36
-
37
-
38
-
39
-
40
-
41
-
42
-
43
-
44
-
45
-
46
-
47
-
48
-
49
-
50
-
51
-
52
-
53
-
54
-
55
-
56
-
57
-
58
-
59
-
60
-
61
-
62
-
63
-
64
-
65
-
66
-
67
-
68
-
69
-
70
-
71
-
72
-
73
-
74
-
75
-
76
-
77
-
78
-
79
-
80
-
81
-
82
-
83
-
84
-
85
-
86
-
87
-
88
-
89
-
90
-
91
-
92
-
93
-
94
-
95
-
96
-
97
-
98
-
99
-
100
-
101
-
102
-
103
-
104
-
105
-
106
-
107
-
108
-
109
-
110
-
111
-
112
-
113
-
114
-
115
-
116
-
117
-
118
-
119
-
120
-
121
-
122
-
123
-
124
-
125
-
126
-
127
-
128
-
129
-
130
-
131
-
132
-
133
-
134
-
135
-
136
-
137
-
138
-
139
-
140
-
 141
141 -
 142
142 -
 143
143 -
 144
144 -
 145
145 -
 146
146 -
 147
147 -
 148
148 -
 149
149 -
 150
150 -
 151
151 -
 152
152 -
 153
153 -
 154
154 -
 155
155 -
 156
156 -
 157
157 -
 158
158 -
 159
159 -
 160
160 -
 161
161 -
162
-
163
-
164
-
165
-
166
-
167
-
168
-
169
-
170
-
171
-
172
-
173
-
174
-
175
-
176
-
177
-
178
-
179
-
180
-
181
-
182
-
183
-
184
-
185
-
186
-
187
-
188
-
189
-
190
-
191
-
192
-
193
-
194
-
195
-
196
-
197
-
198
-
199
-
200
-
201
-
202
-
203
-
204
-
205
-
206
-
207
-
208
-
209
-
210
-
211
-
212
-
213
-
214
-
215
-
216
-
217
-
218
-
219
-
220
-
221
-
222
-
223
-
224
-
225
-
226
-
227
-
228
-
229
-
230
-
231
-
232
-
233
-
234
-
235
-
236
-
237
-
238
-
239
-
240
-
241
-
242
-
243
-
244
-
245
-
246
-
247
-
248
-
249
-
250
-
251
-
252
 |
 |

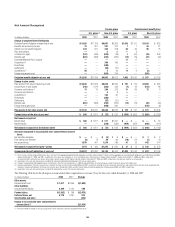
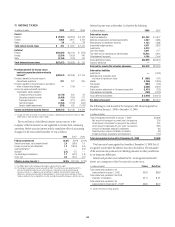
Net Amount Recognized
Pension plans Postretirement benefit plans
U.S. plans (1) Non-U.S. plans U.S. plans Non-U.S. plans
In millions of dollars 2008 2007 2008 2007 2008 2007 2008 2007
Change in projected benefit obligation
Projected benefit obligation at beginning of year $11,029 $11,109 $6,007 $5,363 $1,042 $1,101 $1,193 $ 825
Benefits earned during the year 23 301 201 202 1136 27
Interest cost on benefit obligation 674 641 354 318 62 59 96 75
Plan amendments ——212 —3—
Actuarial loss (gain) (167) (439) (625) (28) 1(67) (79) 296
Benefits paid (607) (583) (282) (269) (72) (75) (41) (39)
Expected Medicare Part D subsidy ————11 11 ——
Acquisitions (2) ——206 156 ————
Divestitures ——(380) —————
Settlements ——(65) (21) ————
Curtailments (3) 58 —325 17 9(2) —
Foreign exchange impact ——(858) 249 — — (266) 9
Projected benefit obligation at year end $11,010 $11,029 $4,563 $6,007 1,062 $1,042 $ 937 $1,193
Change in plan assets
Plan assets at fair value at beginning of year $12,840 $11,932 $6,629 $5,906 $ 191 $ 175 $1,008 $ 984
Actual return on plan assets (730) 1,476 (883) 432 (7) 22 (182) 66
Company contributions (4) 13 15 286 223 31 69 72 3
Employee contributions ——68———
Acquisitions (5) ——165 90 ———
Divestitures ——(380) ————
Settlements ——(57) (21) ———
Benefits paid (607) (583) (282) (269) (72) (75) (42) (39)
Foreign exchange impact ——(948) 260 — — (185) (6)
Plan assets at fair value at year end $11,516 $12,840 $4,536 $6,629 $ 143 $ 191 $ 671 $1,008
Funded status of the plan at year end $ 506 $ 1,811 $ (27) $ 622 $ (919) $ (851) $ (266) $ (185)
Net amount recognized
Benefit asset $ 506 $ 1,811 $ 511 $1,061 $—$— $— $34
Benefit liability ——(538) (439) (919) (851) (266) (219)
Net amount recognized on the balance sheet $ 506 $ 1,811 $ (27) $ 622 $ (919) $ (851) $ (266) $ (185)
Amounts recognized in Accumulated other comprehensive income
(loss):
Net transition obligation $—$—$ (5) $8$—$— $1 $2
Prior service cost (benefit) (4) (7) 29 30 (10) (11) (1) (1)
Net actuarial loss 1,978 467 1,219 786 41 23 442 374
Net amount recognized in equity—pretax 1,974 $ 460 $1,243 $ 824 $31$12 $ 442 $ 375
Accumulated benefit obligation at year end $10,937 $10,960 $4,145 $5,403 $1,062 $1,042 $ 937 $1,193
(1) The U.S. plans exclude nonqualified pension plans, for which the aggregate projected benefit obligation was $586 million and $611 million and the aggregate accumulated benefit obligation was $580 million and $604
million at December 31, 2008 and 2007, respectively. These plans are unfunded. As such, the funded status of these plans is $(586) million and $(611) million at December 31, 2008 and 2007, respectively.
Accumulated other comprehensive income (loss) reflects pretax charges of $72 million and $85 million at December 31, 2008 and 2007, respectively, that primarily relate to net actuarial loss.
(2) Acquisitions in the non-U.S pension plans include $29 million of projected benefit obligations from newly material plans.
(3) Changes in projected benefit obligation due to curtailments in the non-U.S. pension plans in 2008 include $(9) million in curtailment gains and $12 million in special termination costs.
(4) Company contributions to the U.S. pension plan include $13 million and $15 million during 2008 and 2007, respectively, relating to certain investment advisory fees and administrative costs that were absorbed by the
Company. Company contributions to the non-U.S. pension plans include $55 million and $47 million of benefits directly paid by the Company during 2008 and 2007, respectively.
(5) Acquisitions in the non-U.S pension plans include $10 million of plan assets from newly material plans.
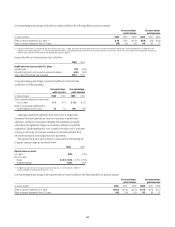
The following table shows the change in Accumulated other comprehensive income (loss) for the years ended December 31, 2008 and 2007:
In millions of dollars 2008 2007 Change
Other assets
Prepaid benefit cost $ 1,017 $2,906 $(1,889)
Other liabilities
Accrued benefit liability 2,309 2,120 189
Funded status $(1,292) $ 786 $(2,078)
Deferred taxes, net 5,179 4,261 918
Amortization and other (259)
Change in Accumulated other comprehensive
income (loss) (1) $(1,419)
(1) Primarily related to changes in net actuarial gain/loss of the Company’s pension and postretirement plans.
145