Citibank 2008 Annual Report Download - page 188
Download and view the complete annual report
Please find page 188 of the 2008 Citibank annual report below. You can navigate through the pages in the report by either clicking on the pages listed below, or by using the keyword search tool below to find specific information within the annual report.-
 1
1 -
2
-
3
-
4
-
5
-
6
-
7
-
8
-
9
-
10
-
11
-
12
-
13
-
14
-
15
-
16
-
17
-
18
-
19
-
20
-
21
-
22
-
23
-
24
-
25
-
26
-
27
-
28
-
29
-
30
-
31
-
32
-
33
-
34
-
35
-
36
-
37
-
38
-
39
-
40
-
41
-
42
-
43
-
44
-
45
-
46
-
47
-
48
-
49
-
50
-
51
-
52
-
53
-
54
-
55
-
56
-
57
-
58
-
59
-
60
-
61
-
62
-
63
-
64
-
65
-
66
-
67
-
68
-
69
-
70
-
71
-
72
-
73
-
74
-
75
-
76
-
77
-
78
-
79
-
80
-
81
-
82
-
83
-
84
-
85
-
86
-
87
-
88
-
89
-
90
-
91
-
92
-
93
-
94
-
95
-
96
-
97
-
98
-
99
-
100
-
101
-
102
-
103
-
104
-
105
-
106
-
107
-
108
-
109
-
110
-
111
-
112
-
113
-
114
-
115
-
116
-
117
-
118
-
119
-
120
-
121
-
122
-
123
-
124
-
125
-
126
-
127
-
128
-
129
-
130
-
131
-
132
-
133
-
134
-
135
-
136
-
137
-
138
-
139
-
140
-
141
-
142
-
143
-
144
-
145
-
146
-
147
-
148
-
149
-
150
-
151
-
152
-
153
-
154
-
155
-
156
-
157
-
158
-
159
-
160
-
161
-
162
-
163
-
164
-
165
-
166
-
167
-
168
-
169
-
170
-
171
-
172
-
173
-
174
-
175
-
176
-
177
-
 178
178 -
 179
179 -
 180
180 -
 181
181 -
 182
182 -
 183
183 -
 184
184 -
 185
185 -
 186
186 -
 187
187 -
 188
188 -
 189
189 -
 190
190 -
 191
191 -
 192
192 -
 193
193 -
 194
194 -
 195
195 -
 196
196 -
 197
197 -
 198
198 -
199
-
200
-
201
-
202
-
203
-
204
-
205
-
206
-
207
-
208
-
209
-
210
-
211
-
212
-
213
-
214
-
215
-
216
-
217
-
218
-
219
-
220
-
221
-
222
-
223
-
224
-
225
-
226
-
227
-
228
-
229
-
230
-
231
-
232
-
233
-
234
-
235
-
236
-
237
-
238
-
239
-
240
-
241
-
242
-
243
-
244
-
245
-
246
-
247
-
248
-
249
-
250
-
251
-
252
 |
 |

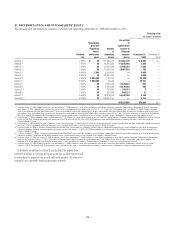
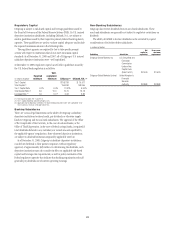
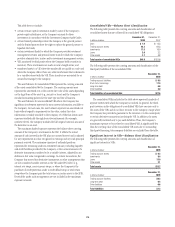
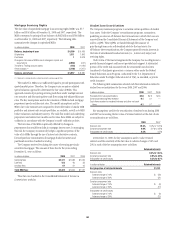
Mortgage Servicing Rights
The fair value of capitalized mortgage loan servicing rights (MSR) was $5.7
billion and $8.4 billion at December 31, 2008 and 2007, respectively. The
MSRs correspond to principal loan balances of $662 billion and $586 billion
as of December 31, 2008 and 2007, respectively. The following table
summarizes the changes in capitalized MSRs:
In millions of dollars 2008 2007
Balance, beginning of year $ 8,380 $ 5,439
Originations 1,311 1,843
Purchases 13,678
Changes in fair value of MSRs due to changes in inputs and
assumptions (2,682) (247)
Transfer to Trading account assets (163) (1,026)
Other changes (1) (1,190) (1,307)
Balance, end of year $ 5,657 $ 8,380
(1) Represents changes due to customer payments and passage of time.
The market for MSRs is not sufficiently liquid to provide participants with
quoted market prices. Therefore, the Company uses an option-adjusted
spread valuation approach to determine the fair value of MSRs. This
approach consists of projecting servicing cash flows under multiple interest
rate scenarios and discounting these cash flows using risk-adjusted discount
rates. The key assumptions used in the valuation of MSRs include mortgage
prepayment speeds and discount rates. The model assumptions and the
MSR’s fair value estimates are compared to observable trades of similar MSR
portfolios and interest-only security portfolios, as available, as well as to MSR
broker valuations and industry surveys. The cash flow model and underlying
prepayment and interest rate models used to value these MSRs are subject to
validation in accordance with the Company’s model validation policies.
The fair value of the MSRs is primarily affected by changes in
prepayments that result from shifts in mortgage interest rates. In managing
this risk, the Company economically hedges a significant portion of the
value of its MSRs through the use of interest rate derivative contracts,
forward purchase commitments of mortgage-backed securities and
purchased securities classified as trading.
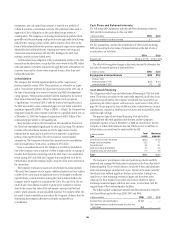
The Company receives fees during the course of servicing previously
securitized mortgages. The amount of these fees for the years ending
December 31, were as follows:
In millions of dollars 2008 2007 2006
Servicing fees $2,121 $1,683 $1,036
Late fees 123 90 56
Ancillary fees 81 61 45
Total MSR fees $2,325 $1,834 $1,137
These fees are classified in the Consolidated Statement of Income as
Commissions and fees.
Student Loan Securitizations
The Company maintains programs to securitize certain portfolios of student
loan assets. Under the Company’s securitization programs, transactions
qualifying as sales are off-balance sheet transactions in which the loans are
removed from the Consolidated Financial Statements of the Company and
sold to a QSPE. These QSPEs are funded through the issuance of
pass-through term notes collateralized solely by the trust assets. For
off-balance sheet securitizations, the Company generally retains interests in
the form of subordinated residual interests (i.e., interest-only strips) and
servicing rights.
Under terms of the trust arrangements the Company has no obligations to
provide financial support and has not provided such support. A substantial
portion of the credit risk associated with the securitized loans has been
transferred to third party guarantors or insurers either under the Federal
Family Education Loan Program, authorized by the U.S. Department of
Education under the Higher Education Act of 1965, as amended, or private
credit insurance.
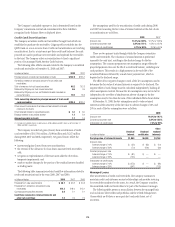
The following table summarizes selected cash flow information related to
student loan securitizations for the years 2008, 2007 and 2006:
In billions of dollars 2008 2007 2006
Proceeds from new securitizations $2.0 $2.9 $7.6
Contractual servicing fees received 0.1 0.1 —
Cash flows received on retained interests and other net cash
flows 0.1 0.1 —
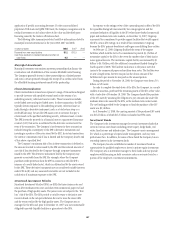
Key assumptions used for the securitization of student loans during 2008
and 2007 in measuring the fair value of retained interests at the date of sale
or securitization are as follows:
2008 2007
Discount rate 10.6% 5.9% to 10.5%
Constant prepayment rate 9.0% 3.1% to 3.8%
Anticipated net credit losses 0.5% 0.3%
At December 31, 2008, the key assumptions used to value retained
interests and the sensitivity of the fair value to adverse changes of 10% and
20% in each of the key assumptions were as follows:
Retained interests
Discount rate 3.9% to 13.4%
Constant prepayment rate 0.8% to 8.9%
Anticipated net credit losses 0.3% to 0.7%
In millions of dollars Retained interests
Carrying value of retained interests $1,151
Discount rates
Adverse change of 10% $ (26)
Adverse change of 20% (51)
Constant prepayment rate
Adverse change of 10% $ (9)
Adverse change of 20% (17)
Anticipated net credit losses
Adverse change of 10% $ (6)
Adverse change of 20% (13)
182