Citibank 2008 Annual Report Download - page 10
Download and view the complete annual report
Please find page 10 of the 2008 Citibank annual report below. You can navigate through the pages in the report by either clicking on the pages listed below, or by using the keyword search tool below to find specific information within the annual report.-
 1
1 -
 2
2 -
 3
3 -
 4
4 -
 5
5 -
 6
6 -
 7
7 -
 8
8 -
 9
9 -
 10
10 -
 11
11 -
 12
12 -
 13
13 -
 14
14 -
 15
15 -
 16
16 -
 17
17 -
 18
18 -
 19
19 -
 20
20 -
 21
21 -
22
-
23
-
24
-
25
-
26
-
27
-
28
-
29
-
30
-
31
-
32
-
33
-
34
-
35
-
36
-
37
-
38
-
39
-
40
-
41
-
42
-
43
-
44
-
45
-
46
-
47
-
48
-
49
-
50
-
51
-
52
-
53
-
54
-
55
-
56
-
57
-
58
-
59
-
60
-
61
-
62
-
63
-
64
-
65
-
66
-
67
-
68
-
69
-
70
-
71
-
72
-
73
-
74
-
75
-
76
-
77
-
78
-
79
-
80
-
81
-
82
-
83
-
84
-
85
-
86
-
87
-
88
-
89
-
90
-
91
-
92
-
93
-
94
-
95
-
96
-
97
-
98
-
99
-
100
-
101
-
102
-
103
-
104
-
105
-
106
-
107
-
108
-
109
-
110
-
111
-
112
-
113
-
114
-
115
-
116
-
117
-
118
-
119
-
120
-
121
-
122
-
123
-
124
-
125
-
126
-
127
-
128
-
129
-
130
-
131
-
132
-
133
-
134
-
135
-
136
-
137
-
138
-
139
-
140
-
141
-
142
-
143
-
144
-
145
-
146
-
147
-
148
-
149
-
150
-
151
-
152
-
153
-
154
-
155
-
156
-
157
-
158
-
159
-
160
-
161
-
162
-
163
-
164
-
165
-
166
-
167
-
168
-
169
-
170
-
171
-
172
-
173
-
174
-
175
-
176
-
177
-
178
-
179
-
180
-
181
-
182
-
183
-
184
-
185
-
186
-
187
-
188
-
189
-
190
-
191
-
192
-
193
-
194
-
195
-
196
-
197
-
198
-
199
-
200
-
201
-
202
-
203
-
204
-
205
-
206
-
207
-
208
-
209
-
210
-
211
-
212
-
213
-
214
-
215
-
216
-
217
-
218
-
219
-
220
-
221
-
222
-
223
-
224
-
225
-
226
-
227
-
228
-
229
-
230
-
231
-
232
-
233
-
234
-
235
-
236
-
237
-
238
-
239
-
240
-
241
-
242
-
243
-
244
-
245
-
246
-
247
-
248
-
249
-
250
-
251
-
252
 |
 |

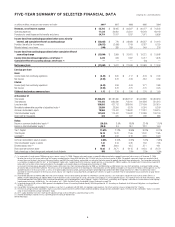
FIVE-YEAR SUMMARY OF SELECTED FINANCIAL DATA Citigroup Inc. and Subsidiaries
In millions of dollars, except per share amounts and ratios 2008 (1) 2007 2006 2005 2004
Revenues, net of interest expense $ 52,793 $ 78,495 $ 86,327 $ 80,077 $ 76,223
Operating expenses 71,134 59,802 50,301 43,549 48,149
Provisions for credit losses and for benefits and claims 34,714 17,917 7,537 7,971 6,658
Income (loss) from continuing operations before taxes, minority
interest, and cumulative effect of accounting change $ (53,055) $ 776 $ 28,489 $ 28,557 $ 21,416
Provision (benefits) for income taxes (20,612) (2,498) 7,749 8,787 6,130
Minority interest, net of taxes (349) 285 289 549 218
Income (loss) from continuing operations before cumulative effect of
accounting change $ (32,094) $ 2,989 $ 20,451 $ 19,221 $ 15,068
Income from discontinued operations, net of taxes (2) 4,410 628 1,087 5,417 1,978
Cumulative effect of accounting change, net of taxes (3) —— — (49) —
Net income (loss) $ (27,684) $ 3,617 $ 21,538 $ 24,589 $ 17,046
Earnings per share
Basic:
Income (loss) from continuing operations $ (6.42) $ 0.60 $ 4.17 $ 3.78 $ 2.94
Net income (5.59) 0.73 4.39 4.84 3.32
Diluted:
Income (loss) from continuing operations (6.42) 0.59 4.09 3.71 2.88
Net income (5.59) 0.72 4.31 4.75 3.26
Dividends declared per common share $ 1.12 $ 2.16 $ 1.96 $ 1.76 $ 1.60
At December 31
Total assets $1,938,470 $2,187,480 $1,884,167 $1,493,886 $1,483,950
Total deposits 774,185 826,230 712,041 591,828 561,513
Long-term debt 359,593 427,112 288,494 217,499 207,910
Mandatorily redeemable securities of subsidiary trusts (4) 23,899 23,594 9,579 6,264 6,209
Common stockholders’ equity 70,966 113,447 118,632 111,261 108,015
Total stockholders’ equity 141,630 113,447 119,632 112,386 109,140
Direct staff (in thousands) 323 375 327 296 283
Ratios:
Return on common stockholders’ equity (5) (28.8)% 2.9% 18.8% 22.4% 17.0%
Return on total stockholders’ equity (5) (20.9) 3.0 18.7 22.2 16.9
Tier 1 Capital 11.92% 7.12% 8.59% 8.79% 8.74%
Total Capital 15.70 10.70 11.65 12.02 11.85
Leverage (6) 6.08 4.03 5.16 5.35 5.20
Common stockholders’ equity to assets 3.66% 5.19% 6.30% 7.45% 7.28%
Total stockholders’ equity to assets 7.31 5.19 6.35 7.52 7.35
Dividend payout ratio (7) NM 300.0 45.5 37.1 49.1
Book value per common share $ 13.02 $ 22.71 $ 24.15 $ 22.34 $ 20.79
Ratio of earnings to fixed charges and preferred stock dividends NM 1.01x 1.50x 1.79x 1.99x
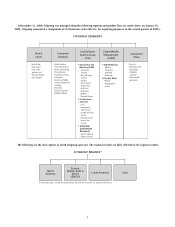
(1) As announced in its fourth quarter 2008 earnings press release (January 16, 2009), Citigroup continued to review its goodwill to determine whether a goodwill impairment had occurred as of December 31, 2008.
Based on the results of this review and testing, the Company recorded a pretax charge of $9.568 billion ($8.727 billion after-tax) in the fourth quarter of 2008. The goodwill impairment charge was recorded in North
America Consumer Banking,Latin America Consumer Banking, and EMEA Consumer Banking, and resulted in a write-off of the entire amount of goodwill allocated to those reporting units. The charge does not result in
a cash outflow or negatively affect the Tier 1 or Total Regulatory Capital ratios, Tangible Equity or the Company’s liquidity position as of December 31, 2008. In addition, Citi recorded a $374 million pretax charge ($242
million after-tax) to reflect further impairment evident in the intangible asset related to Nikko Asset Management at December 31, 2008.
As disclosed in the table above, giving effect to these charges, Net Income (Loss) from Continuing Operations for 2008 was $(32.094) billion and Net Income (Loss) was $(27.684) billion, resulting in Diluted Earnings
per Share of $(6.42) and $(5.59) respectively. The primary cause for the goodwill impairment in the reporting units mentioned above, and the additional intangible asset impairment in Nikko Asset Management, was the
rapid deterioration in the financial markets, as well as in the general global economic outlook, particularly during the period beginning mid-November 2008 through December 31, 2008. This deterioration further
weakened the near term prospects for the financial services industry. See “Significant Accounting Policies and Significant Estimates” on page 18, and Note 19 to the Consolidated Financial Statements on page 166 for
further discussion.
(2) Discontinued operations for 2004 to 2008 reflect the sale of Citigroup’s German Retail Banking Operations to Credit Mutuel, and the Company’s sale of CitiCapital’s equipment finance unit to General Electric. In
addition, discontinued operations for 2004 to 2006 include the operations and associated gain on sale of substantially all of Citigroup’s Asset Management business, the majority of which closed on December 1, 2005.
Discontinued operations from 2004 to 2006 also include the operations and associated gain on sale of Citigroup’s Travelers Life & Annuity, substantially all of Citigroup’s international insurance business and Citigroup’s
Argentine pension business to MetLife Inc. The sale closed on July 1, 2005. See Note 3 to the Consolidated Financial Statements on page 136.
(3) Accounting change of $(49) million in 2005 represents the adoption of Financial Accounting Standards Board (FASB) Interpretation No. 47, Accounting for Conditional Asset Retirement Obligations, an interpretation of
SFAS No. 143, (FIN 47).
(4) During 2004, the Company deconsolidated the subsidiary issuer trusts in accordance with FIN 46(R). For regulatory capital purposes, these trust securities remain a component of Tier 1 Capital.
(5) The return on average common stockholders’ equity is calculated using net income less preferred stock dividends divided by average common stockholders’ equity. The return on total stockholders’ equity is calculated
using net income divided by average stockholders’ equity.
(6) Tier 1 Capital divided by each year’s fourth quarter adjusted average assets (hereinafter as adjusted average assets).
(7) Dividends declared per common share as a percentage of net income per diluted share.
NM Not Meaningful
4