Citibank 2008 Annual Report Download - page 94
Download and view the complete annual report
Please find page 94 of the 2008 Citibank annual report below. You can navigate through the pages in the report by either clicking on the pages listed below, or by using the keyword search tool below to find specific information within the annual report.-
 1
1 -
2
-
3
-
4
-
5
-
6
-
7
-
8
-
9
-
10
-
11
-
12
-
13
-
14
-
15
-
16
-
17
-
18
-
19
-
20
-
21
-
22
-
23
-
24
-
25
-
26
-
27
-
28
-
29
-
30
-
31
-
32
-
33
-
34
-
35
-
36
-
37
-
38
-
39
-
40
-
41
-
42
-
43
-
44
-
45
-
46
-
47
-
48
-
49
-
50
-
51
-
52
-
53
-
54
-
55
-
56
-
57
-
58
-
59
-
60
-
61
-
62
-
63
-
64
-
65
-
66
-
67
-
68
-
69
-
70
-
71
-
72
-
73
-
74
-
75
-
76
-
77
-
78
-
79
-
80
-
81
-
82
-
83
-
 84
84 -
 85
85 -
 86
86 -
 87
87 -
 88
88 -
 89
89 -
 90
90 -
 91
91 -
 92
92 -
 93
93 -
 94
94 -
 95
95 -
 96
96 -
 97
97 -
 98
98 -
 99
99 -
 100
100 -
 101
101 -
 102
102 -
 103
103 -
 104
104 -
105
-
106
-
107
-
108
-
109
-
110
-
111
-
112
-
113
-
114
-
115
-
116
-
117
-
118
-
119
-
120
-
121
-
122
-
123
-
124
-
125
-
126
-
127
-
128
-
129
-
130
-
131
-
132
-
133
-
134
-
135
-
136
-
137
-
138
-
139
-
140
-
141
-
142
-
143
-
144
-
145
-
146
-
147
-
148
-
149
-
150
-
151
-
152
-
153
-
154
-
155
-
156
-
157
-
158
-
159
-
160
-
161
-
162
-
163
-
164
-
165
-
166
-
167
-
168
-
169
-
170
-
171
-
172
-
173
-
174
-
175
-
176
-
177
-
178
-
179
-
180
-
181
-
182
-
183
-
184
-
185
-
186
-
187
-
188
-
189
-
190
-
191
-
192
-
193
-
194
-
195
-
196
-
197
-
198
-
199
-
200
-
201
-
202
-
203
-
204
-
205
-
206
-
207
-
208
-
209
-
210
-
211
-
212
-
213
-
214
-
215
-
216
-
217
-
218
-
219
-
220
-
221
-
222
-
223
-
224
-
225
-
226
-
227
-
228
-
229
-
230
-
231
-
232
-
233
-
234
-
235
-
236
-
237
-
238
-
239
-
240
-
241
-
242
-
243
-
244
-
245
-
246
-
247
-
248
-
249
-
250
-
251
-
252
 |
 |
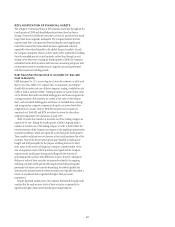
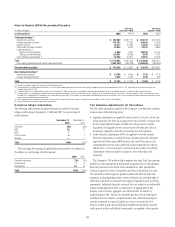
Reclassifications of debt securities were made at fair value on the date of transfer. The impact of the transfers executed during the fourth quarter of 2008 is
detailed in the following table followed by a, summarized by type of securities:
In millions of dollars
Carrying value at
December 31, 2008
Debt securities reclassified from Trading account assets to held-to-maturity investment $33,258
Debt securities reclassified from available-for-sale investments to held-to-maturity investments 27,005
Total debt securities reclassified to held-to-maturity investments $60,263
Debt and equity securities reclassified from Trading account assets to available-for-sale investments $ 4,654
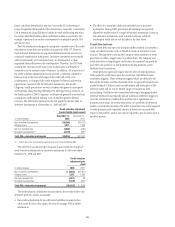
In millions of dollars Amortized cost(1)
Carrying value at
December 31,
2008(2)
Fair value at
December 31,
2008(2)
Debt securities reclassified to held-to-maturity investments
Mortgage-backed securities $37,719 $30,738 $27,751
State and municipal 4,898 4,548 4,327
Other debt securities 25,665 24,977 24,432
Total debt securities reclassified to held-to-maturity investments $68,282 $60,263 $56,510
Debt and equity securities reclassified to available-for-sale investments
Mortgage-backed securities $ 109 $ 72 $ 72
State and municipal 2,235 2,111 2,111
Other debt and equity securities 2,368 2,471 2,471
Total debt and equity securities reclassified to available-for-sale investments $ 4,712 $ 4,654 $ 4,654
(1) For securities transferred to held-to-maturity from Trading account assets, amortized cost is defined as the fair value amount of the securities at the date of transfer. For securities transferred to held-to-maturity from
available-for-sale, amortized cost is defined as the original purchase cost, plus or minus any accretion or amortization of interest, less any impairment previously recognized in earnings.
(2) The difference between the carrying value and fair value at December 31, 2008 for those securities reclassified to HTM is not recognized in the Company’s financial statements, while the difference for securities
reclassified from Trading account assets to AFS is recognized with the change recorded in AOCI.
(3) Excluded from these tables is $4.2 billion of HTM securities that were purchased during the fourth quarter of 2008, in accordance with prior commitments. These purchases consisted of $1.3 billion of auction-rate
securities and $2.9 billion of auto note securities.
The net unrealized losses arising prior to the reclassification date and
classified in AOCI of $8.0 billion as of December 31, 2008, for debt securities
reclassified from AFS investments to HTM investments have been segregated
within AOCI. This balance will be amortized over the remaining life of the
related securities as an adjustment of yield in a manner consistent with the
accretion of discount on the same transferred debt securities. This will have
no impact on the Company’s net income because the amortization of the
unrealized holding loss reported in equity will offset the effect on the interest
income of the accretion of the discount on these securities.
88