Citibank 2008 Annual Report Download - page 48
Download and view the complete annual report
Please find page 48 of the 2008 Citibank annual report below. You can navigate through the pages in the report by either clicking on the pages listed below, or by using the keyword search tool below to find specific information within the annual report.-
 1
1 -
2
-
3
-
4
-
5
-
6
-
7
-
8
-
9
-
10
-
11
-
12
-
13
-
14
-
15
-
16
-
17
-
18
-
19
-
20
-
21
-
22
-
23
-
24
-
25
-
26
-
27
-
28
-
29
-
30
-
31
-
32
-
33
-
34
-
35
-
36
-
37
-
 38
38 -
 39
39 -
 40
40 -
 41
41 -
 42
42 -
 43
43 -
 44
44 -
 45
45 -
 46
46 -
 47
47 -
 48
48 -
 49
49 -
 50
50 -
 51
51 -
 52
52 -
 53
53 -
 54
54 -
 55
55 -
 56
56 -
 57
57 -
 58
58 -
59
-
60
-
61
-
62
-
63
-
64
-
65
-
66
-
67
-
68
-
69
-
70
-
71
-
72
-
73
-
74
-
75
-
76
-
77
-
78
-
79
-
80
-
81
-
82
-
83
-
84
-
85
-
86
-
87
-
88
-
89
-
90
-
91
-
92
-
93
-
94
-
95
-
96
-
97
-
98
-
99
-
100
-
101
-
102
-
103
-
104
-
105
-
106
-
107
-
108
-
109
-
110
-
111
-
112
-
113
-
114
-
115
-
116
-
117
-
118
-
119
-
120
-
121
-
122
-
123
-
124
-
125
-
126
-
127
-
128
-
129
-
130
-
131
-
132
-
133
-
134
-
135
-
136
-
137
-
138
-
139
-
140
-
141
-
142
-
143
-
144
-
145
-
146
-
147
-
148
-
149
-
150
-
151
-
152
-
153
-
154
-
155
-
156
-
157
-
158
-
159
-
160
-
161
-
162
-
163
-
164
-
165
-
166
-
167
-
168
-
169
-
170
-
171
-
172
-
173
-
174
-
175
-
176
-
177
-
178
-
179
-
180
-
181
-
182
-
183
-
184
-
185
-
186
-
187
-
188
-
189
-
190
-
191
-
192
-
193
-
194
-
195
-
196
-
197
-
198
-
199
-
200
-
201
-
202
-
203
-
204
-
205
-
206
-
207
-
208
-
209
-
210
-
211
-
212
-
213
-
214
-
215
-
216
-
217
-
218
-
219
-
220
-
221
-
222
-
223
-
224
-
225
-
226
-
227
-
228
-
229
-
230
-
231
-
232
-
233
-
234
-
235
-
236
-
237
-
238
-
239
-
240
-
241
-
242
-
243
-
244
-
245
-
246
-
247
-
248
-
249
-
250
-
251
-
252
 |
 |

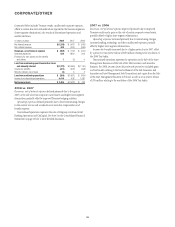
ASIA
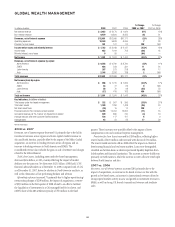
In millions of dollars 2008 2007 2006
% Change
2008 vs. 2007
% Change
2007 vs. 2006
Net interest revenue $ 9,648 $ 8,290 $ 7,441 16% 11%
Non-interest revenue 5,988 10,538 6,349 (43) 66
Revenues, net of interest expense $15,636 $18,828 $13,790 (17)% 37%
Operating expenses 12,047 10,145 7,428 19 37
Provisions for loan losses and for benefits and claims 3,627 2,396 1,640 51 46
Income before taxes and minority interest $ (38) $ 6,287 $ 4,722 (101)% 33%
Income taxes (1,646) 1,601 1,220 NM 31
Minority interest, net of taxes (11) 93 2 NM NM
Net income $ 1,619 $ 4,593 $ 3,500 (65)% 31%
Average assets (in billions of dollars) $ 354 $ 321 $ 227 10% 41%
Return on assets 0.46% 1.43% 1.54%
Consumer Finance Japan (CFJ)—NIR $ 726 $ 1,135 $ 1,566 (36)% (28)%
Asia excluding CFJ—NIR 8,922 7,155 5,875 25 22
CFJ—operating expenses $ 371 $ 576 $ 713 (36)% (19)%
Asia excluding CFJ—operating expenses 11,676 9,596 6,715 22 43
CFJ—provision for loan losses and for benefits and claims $ 1,336 $ 1,421 $ 1,118 (6)% 27%
Asia excluding CFJ—provision for loan losses and for benefits and claims 2,291 975 522 NM 87
CFJ—net income (loss) $ 146 $ (520) $ (133) NM NM
Asia excluding CFJ—net income 1,473 5,113 3,633 (71)% 41%
Key indicators (in billions of dollars, except in branches)
Average loans $ 128.7 $ 125.8 $ 108.4 2% 16%
Average Consumer Banking loans
(excluding CFJ) 49.2 46.2 38.9 619
Average deposits (and other consumer liability balances) 207.2 193.4 167.7 715
Branches/offices 1,192 1,333 1,235 (11) 8
NM Not meaningful.
2008 vs. 2007
Net interest revenue increased 16%. Global Cards growth of 13% was
driven by 12% growth in purchase sales and 18% growth in average loans.
Consumer Banking, excluding Consumer Finance Japan (CFJ), grew by
10%, driven by growth of 6% in average loans and 4% growth in deposits.
Transaction Services exhibited strong growth across all products resulting in
19% growth. S&B grew 90%, or $966 million, reflecting better spreads
during the year and higher dividend revenue. Growth was also positively
impacted by FX translation, acquisitions and portfolio purchases.
Non-interest revenue decreased 43% as S&B continued to be impacted
by market volatility and declining valuations. Outside of S&B, non-interest
revenue decreased 2% due to the absence of gain on Visa shares compared
to the prior year, in Transaction Services and Global Cards. Excluding this,
revenue was flat with strong growth in Global Cards, Transaction Services
and GWM, offset by lower Investment Sales in Consumer Banking and
GWM. Results included a $31 million gain on the sale of DCI, partially
offset by a $21 million gain on the sale of MasterCard shares in the prior
year. Growth was also negatively impacted by foreign exchange,
acquisitions and portfolio purchases.
Operating expenses increased 19% reflecting the impact of acquisitions,
a $937 million Nikko Asset Management intangible impairment charge, the
impact of the strengthening of local currencies and restructuring/
repositioning charges, partially offset by the benefits of reengineering
efforts.
Provisions for loan losses and for benefits and claims increased 51%
primarily driven by a $574 million incremental pretax charge to increase
loan loss reserves, increased credit costs in India, acquisitions and portfolio
growth.
Taxes included a $994 million tax benefit related to the legal vehicle
restructuring of the CFJ operations.
Asia Excluding CFJ
As disclosed in the table above, NIR excluding CFJ increased 25% during
2008. Operating expenses excluding CFJ increased 22% during 2008 and
Net Income excluding CFJ decreased 71%.
2007 vs. 2006
Net interest revenue increased 11%. Global Cards growth of 24% was driven
by 12% growth in purchase sales and 19% growth in average loans.
Consumer Banking excluding CFJ grew by 20%, driven by growth of 19% in
average loans and 8% growth in deposits. Transaction Services exhibited
42