Citibank 2008 Annual Report Download - page 185
Download and view the complete annual report
Please find page 185 of the 2008 Citibank annual report below. You can navigate through the pages in the report by either clicking on the pages listed below, or by using the keyword search tool below to find specific information within the annual report.-
 1
1 -
2
-
3
-
4
-
5
-
6
-
7
-
8
-
9
-
10
-
11
-
12
-
13
-
14
-
15
-
16
-
17
-
18
-
19
-
20
-
21
-
22
-
23
-
24
-
25
-
26
-
27
-
28
-
29
-
30
-
31
-
32
-
33
-
34
-
35
-
36
-
37
-
38
-
39
-
40
-
41
-
42
-
43
-
44
-
45
-
46
-
47
-
48
-
49
-
50
-
51
-
52
-
53
-
54
-
55
-
56
-
57
-
58
-
59
-
60
-
61
-
62
-
63
-
64
-
65
-
66
-
67
-
68
-
69
-
70
-
71
-
72
-
73
-
74
-
75
-
76
-
77
-
78
-
79
-
80
-
81
-
82
-
83
-
84
-
85
-
86
-
87
-
88
-
89
-
90
-
91
-
92
-
93
-
94
-
95
-
96
-
97
-
98
-
99
-
100
-
101
-
102
-
103
-
104
-
105
-
106
-
107
-
108
-
109
-
110
-
111
-
112
-
113
-
114
-
115
-
116
-
117
-
118
-
119
-
120
-
121
-
122
-
123
-
124
-
125
-
126
-
127
-
128
-
129
-
130
-
131
-
132
-
133
-
134
-
135
-
136
-
137
-
138
-
139
-
140
-
141
-
142
-
143
-
144
-
145
-
146
-
147
-
148
-
149
-
150
-
151
-
152
-
153
-
154
-
155
-
156
-
157
-
158
-
159
-
160
-
161
-
162
-
163
-
164
-
165
-
166
-
167
-
168
-
169
-
170
-
171
-
172
-
173
-
174
-
 175
175 -
 176
176 -
 177
177 -
 178
178 -
 179
179 -
 180
180 -
 181
181 -
 182
182 -
 183
183 -
 184
184 -
 185
185 -
 186
186 -
 187
187 -
 188
188 -
 189
189 -
 190
190 -
 191
191 -
 192
192 -
 193
193 -
 194
194 -
 195
195 -
196
-
197
-
198
-
199
-
200
-
201
-
202
-
203
-
204
-
205
-
206
-
207
-
208
-
209
-
210
-
211
-
212
-
213
-
214
-
215
-
216
-
217
-
218
-
219
-
220
-
221
-
222
-
223
-
224
-
225
-
226
-
227
-
228
-
229
-
230
-
231
-
232
-
233
-
234
-
235
-
236
-
237
-
238
-
239
-
240
-
241
-
242
-
243
-
244
-
245
-
246
-
247
-
248
-
249
-
250
-
251
-
252
 |
 |

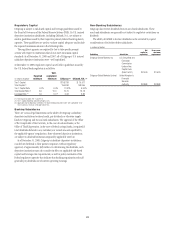
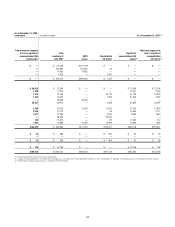
The Company’s unfunded exposure to loss is determined based on the
Company’s maximum contractual commitment less these liabilities
recognized in the Balance Sheet as displayed above.
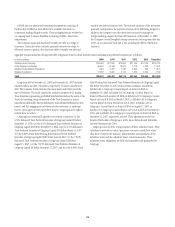
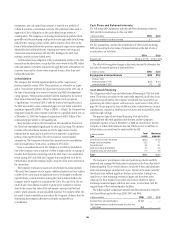
Credit Card Securitizations
The Company securitizes credit card receivables through trusts which are
established to purchase the receivables. Citigroup sells receivables into the
QSPE trusts on a non-recourse basis. Credit card securitizations are revolving
securitizations; that is, as customers pay their credit card balances, the cash
proceeds are used to purchase new receivables and replenish the receivables
in the trust. The Company relies on securitizations to fund a significant
portion of its managed North America Cards business.
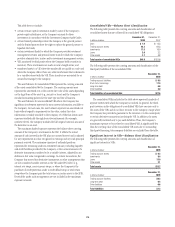
The following table reflects amounts related to the Company’s securitized
credit card receivables at December 31, 2008 and 2007:
In billions of dollars 2008 2007
Principal amount of credit card receivables in trusts $123.9 $125.1
Ownership interests in principal amount of trust credit card
receivables:
Sold to investors via trust-issued securities 98.2 102.3
Retained by Citigroup as trust-issued securities 6.5 4.5
Retained by Citigroup via non-certificated interests recorded as
consumer loans 19.2 18.3
Total ownership interests in principal amount of trust credit
card receivables $123.9 $125.1
Other amounts recorded on the balance sheet related to interests
retained in the trusts:
Other retained interest in securitized assets $ 3.1 $ 3.0
Residual interest in securitized assets(1) 1.7 3.4
Amounts payable to trusts 1.7 1.6
(1) Includes net unbilled interest in sold balances of $0.6 billion and $0.7 billion as of December 31,
2008 and 2007, respectively.
The Company recorded net gains (losses) from securitization of credit
card receivables of $(1,534) million, $1,084 million and $1,267 million
during 2008, 2007 and 2006, respectively. Net gains (losses) reflect the
following:
• incremental gains (losses) from new securitizations;
• the reversal of the allowance for loan losses associated with receivables
sold;
• net gains on replenishments of the trust assets offset by other-than-
temporary impairments; and
• mark-to-market changes for the portion of the residual interest classified
as trading assets.
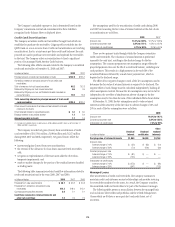
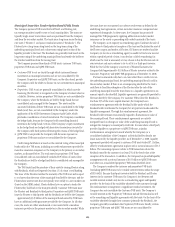
The following table summarizes selected cash flow information related to
credit card securitizations for the years 2008, 2007 and 2006:
In billions of dollars 2008 2007 2006
Proceeds from new securitizations $ 28.7 $ 36.2 $ 20.2
Proceeds from collections reinvested in new
receivables 214.3 218.0 213.1
Contractual servicing fees received 2.0 2.1 2.1
Cash flows received on retained interests and
other net cash flows 7.2 7.6 7.9
Key assumptions used for the securitization of credit cards during 2008
and 2007 in measuring the fair value of retained interests at the date of sale
or securitization are as follows:
2008 2007
Discount rate 13.3% to 20.9% 12.7% to 16.8%
Constant prepayment rate 5.8% to 21.1% 6.5% to 22.0%
Anticipated net credit losses 4.7% to 9.9% 3.4% to 6.4%
There are two primary trusts through which the Company securitizes
credit card receivables. The valuation of retained interests is performed
separately for each trust, resulting in the disclosed range for the key
assumptions. The constant prepayment rate assumption range reflects the
projected payment rates over the life of a credit card balance, excluding new
card purchases. This results in a high payment in the early life of the
securitized balances followed by a much lower payment rate, which is
depicted in the disclosed range.
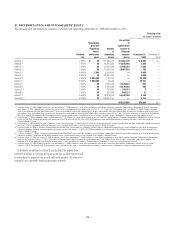
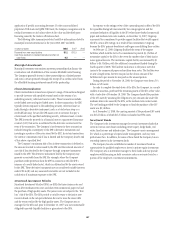
The effect of two negative changes in each of the key assumptions used to
determine the fair value of retained interests is required to be disclosed. The
negative effect of each change must be calculated independently, holding all
other assumptions constant. Because the key assumptions may not in fact be
independent, the net effect of simultaneous adverse changes in the key
assumptions may be less than the sum of the individual effects shown below.
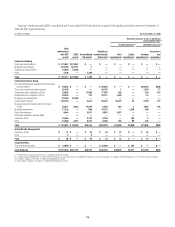
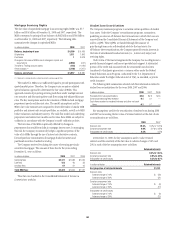
At December 31, 2008, the key assumptions used to value retained
interests and the sensitivity of the fair value to adverse changes of 10% and
20% in each of the key assumptions were as follows:
2008
Discount rate 16.2% to 19.7%
Constant prepayment rate 5.8% to 18.8%
Anticipated net credit losses 7.4% to 9.9%
In millions of dollars
Residual
interest
Retained
certificates
Other
retained
interests
Carrying value of retained interests $1,069 $6,050 $3,763
Discount rates
Adverse change of 10% $ (36) $ (63) $ (10)
Adverse change of 20% (70) (126) (20)
Constant prepayment rate
Adverse change of 10% $ (81) $ — $ —
Adverse change of 20% (153) — —
Anticipated net credit losses
Adverse change of 10% $ (273) $ — $ (66)
Adverse change of 20% (541) — (133)
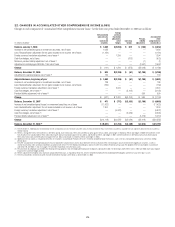
Managed Loans
After securitization of credit card receivables, the Company continues to
maintain credit card customer account relationships and provides servicing
for receivables transferred to the trusts. As a result, the Company considers
the securitized credit card receivables to be part of the business it manages.
The following tables present a reconciliation between the managed basis
and on-balance sheet credit card portfolios and the related delinquencies
(loans which are 90 days or more past due) and credit losses, net of
recoveries.
179