Citibank 2008 Annual Report Download - page 25
Download and view the complete annual report
Please find page 25 of the 2008 Citibank annual report below. You can navigate through the pages in the report by either clicking on the pages listed below, or by using the keyword search tool below to find specific information within the annual report.-
 1
1 -
2
-
3
-
4
-
5
-
6
-
7
-
8
-
9
-
10
-
11
-
12
-
13
-
14
-
 15
15 -
 16
16 -
 17
17 -
 18
18 -
 19
19 -
 20
20 -
 21
21 -
 22
22 -
 23
23 -
 24
24 -
 25
25 -
 26
26 -
 27
27 -
 28
28 -
 29
29 -
 30
30 -
 31
31 -
 32
32 -
 33
33 -
 34
34 -
 35
35 -
36
-
37
-
38
-
39
-
40
-
41
-
42
-
43
-
44
-
45
-
46
-
47
-
48
-
49
-
50
-
51
-
52
-
53
-
54
-
55
-
56
-
57
-
58
-
59
-
60
-
61
-
62
-
63
-
64
-
65
-
66
-
67
-
68
-
69
-
70
-
71
-
72
-
73
-
74
-
75
-
76
-
77
-
78
-
79
-
80
-
81
-
82
-
83
-
84
-
85
-
86
-
87
-
88
-
89
-
90
-
91
-
92
-
93
-
94
-
95
-
96
-
97
-
98
-
99
-
100
-
101
-
102
-
103
-
104
-
105
-
106
-
107
-
108
-
109
-
110
-
111
-
112
-
113
-
114
-
115
-
116
-
117
-
118
-
119
-
120
-
121
-
122
-
123
-
124
-
125
-
126
-
127
-
128
-
129
-
130
-
131
-
132
-
133
-
134
-
135
-
136
-
137
-
138
-
139
-
140
-
141
-
142
-
143
-
144
-
145
-
146
-
147
-
148
-
149
-
150
-
151
-
152
-
153
-
154
-
155
-
156
-
157
-
158
-
159
-
160
-
161
-
162
-
163
-
164
-
165
-
166
-
167
-
168
-
169
-
170
-
171
-
172
-
173
-
174
-
175
-
176
-
177
-
178
-
179
-
180
-
181
-
182
-
183
-
184
-
185
-
186
-
187
-
188
-
189
-
190
-
191
-
192
-
193
-
194
-
195
-
196
-
197
-
198
-
199
-
200
-
201
-
202
-
203
-
204
-
205
-
206
-
207
-
208
-
209
-
210
-
211
-
212
-
213
-
214
-
215
-
216
-
217
-
218
-
219
-
220
-
221
-
222
-
223
-
224
-
225
-
226
-
227
-
228
-
229
-
230
-
231
-
232
-
233
-
234
-
235
-
236
-
237
-
238
-
239
-
240
-
241
-
242
-
243
-
244
-
245
-
246
-
247
-
248
-
249
-
250
-
251
-
252
 |
 |

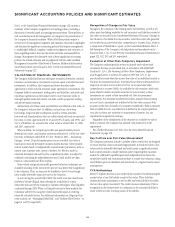
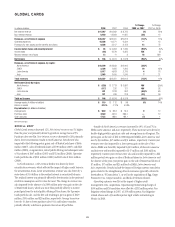
Citi has historically used its credit spreads observed in the credit default
swap (CDS) market to estimate the market value of these liabilities.
Beginning in September 2008, Citi’s CDS spread and credit spreads observed
in the bond market (cash spreads) diverged from each other and from their
historical relationship. For example, the three-year CDS spread narrowed
from 315 basis points (bps) on September 30, 2008, to 202 bps on
December 31, 2008, while the three-year cash spread widened from 430 bps
to 490 bps over the same time period. Due to the persistence and significance
of this divergence during the fourth quarter, management determined that
such a pattern may not be temporary and that using cash spreads would be
more relevant to the valuation of debt instruments (whether issued as
liabilities or purchased as assets). Therefore, Citi changed its method of
estimating the market value of liabilities for which the fair-value option was
elected to incorporate Citi’s cash spreads. (CDS spreads continue to be used
to calculate the CVA for derivative positions, as described on page 92.) This
change in estimation methodology resulted in a $2.5 billion pretax gain
recognized in earnings in the fourth quarter of 2008.
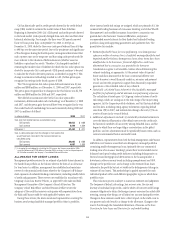
The CVA recognized on fair-value option debt instruments was $5,446
million and $888 million as of December 31, 2008 and 2007, respectively.
The pretax gain recognized due to changes in the CVA balance was $4,558
million and $888 million for 2008 and 2007, respectively.
The table below summarizes the CVA for fair-value option debt
instruments, determined under each methodology as of December 31, 2008
and 2007, and the pretax gain that would have been recognized in the year
then ended had each methodology been used consistently during 2008 and
2007 (in millions of dollars).
In millions of dollars 2008 2007
Year-end CVA reserve balance as calculated using:
CDS spreads $2,953 $ 888
Cash spreads 5,446 1,359
Difference (1) $2,493 $ 471
Year-to-date pretax gain from the change in CVA reserve that
would have been recorded in the income statement as
calculated using:
CDS spreads $2,065 $ 888
Cash spreads 4,087 1,359
(1) In changing the methodology for calculating the CVA reserve, the Company recorded the 2008
cumulative difference of $2.493 billion in December 2008, resulting in a year-to-date pretax gain of
$4.558 billion recorded in the Company’s Consolidated Statement of Income.
ALLOWANCE FOR CREDIT LOSSES
Management provides reserves for an estimate of probable losses inherent in
the funded loan portfolio on the balance sheet in the form of an allowance
for loan losses. In addition, management has established and maintains
reserves for the potential credit losses related to the Company’s off-balance-
sheet exposures of unfunded lending commitments, including standby letters
of credit and guarantees. These reserves are established in accordance with
Citigroup’s Loan Loss Reserve Policies, as approved by the Audit and Risk
Management Committee of the Company’s Board of Directors. The
Company’s Chief Risk Officer and Chief Financial Officer review the
adequacy of the credit loss reserves each quarter with representatives from
the Risk and Finance staffs for each applicable business area.
During these reviews, the above-mentioned representatives covering the
business area having classifiably managed portfolios (that is, portfolios
where internal credit-risk ratings are assigned, which are primarily ICG, the
commercial lending businesses of Consumer Banking and Global Wealth
Management) and modified consumer loans where a concession was
granted due to the borrowers’ financial difficulties, and present
recommended reserve balances for their funded and unfunded lending
portfolios along with supporting quantitative and qualitative data. The
quantitative data include:
•Estimated probable losses for non-performing, non-homogeneous
exposures within a business line’s classifiably managed portfolio and
impaired smaller-balance homogenous loans whose terms have been
modified due to the borrowers’ financial difficulties, and it was
determined that a concession was granted to the borrower.
Consideration is given to all available evidence when determining this
estimate including, as appropriate: (i) the present value of expected
future cash flows discounted at the loan’s contractual effective rate;
(ii) the borrower’s overall financial condition, resources and payment
record; and (iii) the prospects for support from financially responsible
guarantors or the realizable value of any collateral.
•Statistically calculated losses inherent in the classifiably managed
portfolio for performing and de minimis non-performing exposures.
The calculation is based upon: (i) Citigroup’s internal system of credit-
risk ratings, which are analogous to the risk ratings of the major rating
agencies; (ii) the Corporate portfolio database; and (iii) historical default
and loss data, including rating-agency information regarding default
rates from 1983 to 2007, and internal data dating to the early 1970s on
severity of losses in the event of default.
•Additional adjustments include: (i) statistically calculated estimates to
cover the historical fluctuation of the default rates over the credit cycle,
the historical variability of loss severity among defaulted loans, and the
degree to which there are large obligor concentrations in the global
portfolio; and (ii) adjustments made for specifically known items, such as
current environmental factors and credit trends.
In addition, representatives from both the Risk Management and Finance
staffs that cover business areas that have delinquency-managed portfolios
containing smaller homogeneous loans (primarily the non-commercial
lending areas of Consumer Banking) present their recommended reserve
balances based upon leading credit indicators including delinquencies on
first and second mortgages and deterioration in the housing market, a
downturn in other economic trends including unemployment and GDP,
changes in the portfolio size, and a change in the estimated loan losses
inherent in the portfolio but not yet visible in the delinquencies (change in
estimate of loan losses). This methodology is applied separately for each
individual product within each different geographic region in which these
portfolios exist.
This evaluation process is subject to numerous estimates and judgments.
The frequency of default, risk ratings, loss recovery rates, the size and
diversity of individual large credits, and the ability of borrowers with foreign
currency obligations to obtain the foreign currency necessary for orderly debt
servicing, among other things, are all taken into account during this review.
Changes in these estimates could have a direct impact on the credit costs in
any quarter and could result in a change in the allowance. Changes to the
reserve flow through the Consolidated Statement of Income on the lines
Provision for loan losses and Provision for unfunded lending
19