Citibank 2008 Annual Report Download - page 169
Download and view the complete annual report
Please find page 169 of the 2008 Citibank annual report below. You can navigate through the pages in the report by either clicking on the pages listed below, or by using the keyword search tool below to find specific information within the annual report.-
 1
1 -
2
-
3
-
4
-
5
-
6
-
7
-
8
-
9
-
10
-
11
-
12
-
13
-
14
-
15
-
16
-
17
-
18
-
19
-
20
-
21
-
22
-
23
-
24
-
25
-
26
-
27
-
28
-
29
-
30
-
31
-
32
-
33
-
34
-
35
-
36
-
37
-
38
-
39
-
40
-
41
-
42
-
43
-
44
-
45
-
46
-
47
-
48
-
49
-
50
-
51
-
52
-
53
-
54
-
55
-
56
-
57
-
58
-
59
-
60
-
61
-
62
-
63
-
64
-
65
-
66
-
67
-
68
-
69
-
70
-
71
-
72
-
73
-
74
-
75
-
76
-
77
-
78
-
79
-
80
-
81
-
82
-
83
-
84
-
85
-
86
-
87
-
88
-
89
-
90
-
91
-
92
-
93
-
94
-
95
-
96
-
97
-
98
-
99
-
100
-
101
-
102
-
103
-
104
-
105
-
106
-
107
-
108
-
109
-
110
-
111
-
112
-
113
-
114
-
115
-
116
-
117
-
118
-
119
-
120
-
121
-
122
-
123
-
124
-
125
-
126
-
127
-
128
-
129
-
130
-
131
-
132
-
133
-
134
-
135
-
136
-
137
-
138
-
139
-
140
-
141
-
142
-
143
-
144
-
145
-
146
-
147
-
148
-
149
-
150
-
151
-
152
-
153
-
154
-
155
-
156
-
157
-
158
-
 159
159 -
 160
160 -
 161
161 -
 162
162 -
 163
163 -
 164
164 -
 165
165 -
 166
166 -
 167
167 -
 168
168 -
 169
169 -
 170
170 -
 171
171 -
 172
172 -
 173
173 -
 174
174 -
 175
175 -
 176
176 -
 177
177 -
 178
178 -
 179
179 -
180
-
181
-
182
-
183
-
184
-
185
-
186
-
187
-
188
-
189
-
190
-
191
-
192
-
193
-
194
-
195
-
196
-
197
-
198
-
199
-
200
-
201
-
202
-
203
-
204
-
205
-
206
-
207
-
208
-
209
-
210
-
211
-
212
-
213
-
214
-
215
-
216
-
217
-
218
-
219
-
220
-
221
-
222
-
223
-
224
-
225
-
226
-
227
-
228
-
229
-
230
-
231
-
232
-
233
-
234
-
235
-
236
-
237
-
238
-
239
-
240
-
241
-
242
-
243
-
244
-
245
-
246
-
247
-
248
-
249
-
250
-
251
-
252
 |
 |

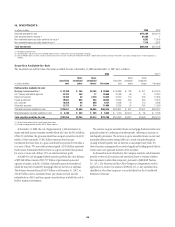
Management develops specific assumptions using as much market data
as possible and includes internal estimates as well as estimates published by
rating agencies and other third-party sources. If the models predict, given the
forward-looking assumptions, that it is not probable that a mortgage-backed
security will recover all principal and interest due, the Company records
other-than-temporary impairment in the Consolidated Statement of Income
equal to the entire decline in fair value of the mortgage-backed security.
Where a mortgage-backed security held as AFS is not deemed to be credit
impaired, management performs additional analysis to assess whether it has
the intent and ability to hold each security for a period of time sufficient for a
forecasted recovery of fair value. In most cases, management has asserted
that it has the intent and ability to hold investments for the forecasted
recovery period, which in some cases may be the security’s maturity date.
Where such an assertion has not been made, the securities’ decline in fair
value is deemed to be other-than-temporary and is recorded in earnings.
Management has asserted significant holding periods for mortgage-backed
securities that in certain cases now approach the maturity of the securities.
The weighted-average estimated life of the securities is currently
approximately 7 years for U.S. mortgage-backed securities. The estimated life
of the securities may change depending on future performance of the
underlying loans, including prepayment activity and experienced credit
losses.
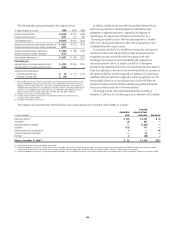
In addition, because of the market disruption that occurred late in the
third quarter of 2008 for state and municipal debt securities, the analysis
regarding these potential impairments have also been refined.
As a result of these analyses, during 2008 the Company recorded
approximately $2.8 billion of pretax losses for other-than-temporary
impairments, $337 million of which was recorded on held-to-maturity
investments after they had been reclassified.
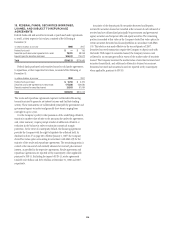
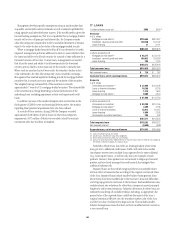
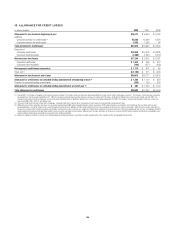
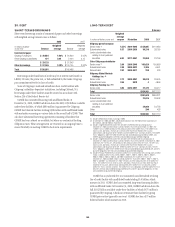
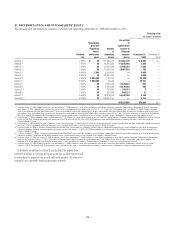
17. LOANS
In millions of dollars at year end 2008 2007 (3)
Consumer
In U.S. offices
Mortgage and real estate (1) $229,565 $251,927
Installment, revolving credit and other 130,826 140,797
Lease financing 31 3,151
$360,422 $395,875
In offices outside the U.S.
Mortgage and real estate (1) $ 48,277 $ 55,152
Installment, revolving credit and other 109,932 139,369
Lease financing 304 1,124
$158,513 $195,645
Total consumer loans $518,935 $591,520
Net unearned income $ 738 $ 787
Consumer loans, net of unearned income $519,673 $592,307
Corporate
In U.S. offices
Commercial and industrial (2) $ 33,450 $ 30,092
Loans to financial institutions 10,200 8,778
Lease financing 1,476 1,630
Mortgage and real estate (1) 6,560 2,220
$ 51,686 $ 42,720
In offices outside the U.S.
Commercial and industrial $ 99,389 $116,145
Mortgage and real estate (1) 7,480 4,156
Loans to financial institutions 18,413 20,467
Lease financing 1,850 2,292
Governments and official institutions 385 442
$127,517 $143,502
Total corporate loans $179,203 $186,222
Net unearned income(4) (4,660) (536)
Corporate loans, net of unearned income $174,543 $185,686
(1) Loans secured primarily by real estate.
(2) Includes loans not otherwise separately categorized.
(3) Reclassified to conform to current year’s presentation.
(4) Increase in unearned income in 2008 relates to the transfer of loans from the held-for-sale category to
the held-for-investment category at a discount to par.
Included in the previous loan table are lending products whose terms
may give rise to additional credit issues. Credit cards with below-market
introductory interest rates, multiple loans supported by the same collateral
(e.g., home equity loans), or interest-only loans are examples of such
products. However, these products are not material to Citigroup’s financial
position and are closely managed via credit controls that mitigate their
additional inherent risk.
Impaired loans are those which Citigroup believes it is probable that it
will not collect all amounts due according to the original contractual terms
of the loan. Impaired loans include smaller-balance homogeneous loans
whose terms have been modified due to the borrower’s financial difficulties
and Citigroup granted a concession to the borrower. Such modifications may
include interest rate reductions for other than a temporary period, principal
forgiveness and/or term extensions. Valuation allowances for these loans are
estimated considering all available evidence including, as appropriate, the
present value of the expected future cash flows discounted at the loan’s
original contractual effective rate, the secondary market value of the loan
and the fair value of collateral less disposal costs. This excludes smaller-
balance homogeneous loans that have not been modified and are carried on
a non-accrual basis.
163