Citibank 2008 Annual Report Download - page 126
Download and view the complete annual report
Please find page 126 of the 2008 Citibank annual report below. You can navigate through the pages in the report by either clicking on the pages listed below, or by using the keyword search tool below to find specific information within the annual report.-
 1
1 -
2
-
3
-
4
-
5
-
6
-
7
-
8
-
9
-
10
-
11
-
12
-
13
-
14
-
15
-
16
-
17
-
18
-
19
-
20
-
21
-
22
-
23
-
24
-
25
-
26
-
27
-
28
-
29
-
30
-
31
-
32
-
33
-
34
-
35
-
36
-
37
-
38
-
39
-
40
-
41
-
42
-
43
-
44
-
45
-
46
-
47
-
48
-
49
-
50
-
51
-
52
-
53
-
54
-
55
-
56
-
57
-
58
-
59
-
60
-
61
-
62
-
63
-
64
-
65
-
66
-
67
-
68
-
69
-
70
-
71
-
72
-
73
-
74
-
75
-
76
-
77
-
78
-
79
-
80
-
81
-
82
-
83
-
84
-
85
-
86
-
87
-
88
-
89
-
90
-
91
-
92
-
93
-
94
-
95
-
96
-
97
-
98
-
99
-
100
-
101
-
102
-
103
-
104
-
105
-
106
-
107
-
108
-
109
-
110
-
111
-
112
-
113
-
114
-
115
-
 116
116 -
 117
117 -
 118
118 -
 119
119 -
 120
120 -
 121
121 -
 122
122 -
 123
123 -
 124
124 -
 125
125 -
 126
126 -
 127
127 -
 128
128 -
 129
129 -
 130
130 -
 131
131 -
 132
132 -
 133
133 -
 134
134 -
 135
135 -
 136
136 -
137
-
138
-
139
-
140
-
141
-
142
-
143
-
144
-
145
-
146
-
147
-
148
-
149
-
150
-
151
-
152
-
153
-
154
-
155
-
156
-
157
-
158
-
159
-
160
-
161
-
162
-
163
-
164
-
165
-
166
-
167
-
168
-
169
-
170
-
171
-
172
-
173
-
174
-
175
-
176
-
177
-
178
-
179
-
180
-
181
-
182
-
183
-
184
-
185
-
186
-
187
-
188
-
189
-
190
-
191
-
192
-
193
-
194
-
195
-
196
-
197
-
198
-
199
-
200
-
201
-
202
-
203
-
204
-
205
-
206
-
207
-
208
-
209
-
210
-
211
-
212
-
213
-
214
-
215
-
216
-
217
-
218
-
219
-
220
-
221
-
222
-
223
-
224
-
225
-
226
-
227
-
228
-
229
-
230
-
231
-
232
-
233
-
234
-
235
-
236
-
237
-
238
-
239
-
240
-
241
-
242
-
243
-
244
-
245
-
246
-
247
-
248
-
249
-
250
-
251
-
252
 |
 |

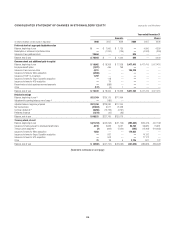
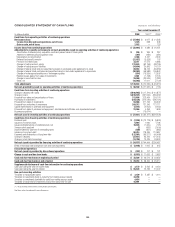
CONSOLIDATED STATEMENT OF CASH FLOWS Citigroup Inc. and Subsidiaries
Year ended December 31
In millions of dollars 2008 2007 (1) 2006 (1)
Cash flows from operating activities of continuing operations
Net income (loss) $ (27,684) $ 3,617 $ 21,538
Income from discontinued operations, net of taxes 1,478 628 948
Gain on sale, net of taxes 2,932 — 139
Income (loss) from continuing operations $ (32,094) $ 2,989 $ 20,451
Adjustments to reconcile net income to net cash provided by (used in) operating activities of continuing operations
Amortization of deferred policy acquisition costs and present value of future profits $ 206 $ 369 $ 287
Additions to deferred policy acquisition costs (397) (482) (381)
Depreciation and amortization 2,466 2,421 2,503
Deferred tax (benefit) provision (21,027) (3,928) 102
Provision for credit losses 33,311 17,574 6,988
Change in trading account assets 123,845 (62,798) (98,105)
Change in trading account liabilities (14,604) 20,893 24,779
Change in federal funds sold and securities borrowed or purchased under agreements to resell 89,933 38,143 (65,353)
Change in federal funds purchased and securities loaned or sold under agreements to repurchase (98,950) (56,983) 106,843
Change in brokerage receivables net of brokerage payables (954) (15,529) 12,503
Realized losses (gains) from sales of investments 2,061 (1,168) (1,791)
Change in loans held-for-sale 29,009 (30,649) (1,282)
Other, net (16,265) 17,611 (7,709)
Total adjustments $ 128,634 $ (74,526) $ (20,616)
Net cash provided by (used in) operating activities of continuing operations $ 96,540 $ (71,537) $ (165)
Cash flows from investing activities of continuing operations
Change in deposits with banks $(100,965) $ (17,216) $ (10,877)
Change in loans $(270,521) (361,934) (356,062)
Proceeds from sales and securitizations of loans 313,808 273,464 253,176
Purchases of investments (344,336) (274,426) (296,124)
Proceeds from sales of investments 93,666 211,753 86,999
Proceeds from maturities of investments 209,312 121,346 121,111
Capital expenditures on premises and equipment (2,541) (4,003) (4,035)
Proceeds from sales of premises and equipment, subsidiaries and affiliates, and repossessed assets 23,966 4,253 1,606
Business acquisitions —(15,614) —
Net cash used in investing activities of continuing operations $ (77,611) $ (62,377) $(204,206)
Cash flows from financing activities of continuing operations
Dividends paid $ (7,526) $ (10,778) $ (9,826)
Issuance of common stock 6,864 1,060 1,798
Issuances (Redemptions) of preferred stock, net 70,626 (1,000) (125)
Treasury stock acquired (7) (663) (7,000)
Stock tendered for payment of withholding taxes (400) (951) (685)
Issuance of long-term debt 90,414 118,496 113,687
Payments and redemptions of long-term debt (132,901) (65,517) (46,468)
Change in deposits (37,811) 93,422 121,203
Change in short-term borrowings (13,796) 10,425 33,903
Net cash (used in) provided by financing activities of continuing operations $ (24,537) $ 144,494 $ 206,487
Effect of exchange rate changes on cash and cash equivalents $ (2,948) $ 1,005 $ 645
Discontinued operations
Net cash (used in) provided by discontinued operations $ (397) $ 107 $ 121
Change in cash and due from banks $ (8,953) $ 11,692 $ 2,882
Cash and due from banks at beginning of period $ 38,206 $ 26,514 $ 23,632
Cash and due from banks at end of period $ 29,253 $ 38,206 $ 26,514
Supplemental disclosure of cash flow information for continuing operations
Cash paid during the year for income taxes $ 3,170 $ 5,923 $ 9,230
Cash paid during the year for interest $ 55,678 72,732 51,472
Non-cash investing activities
Transfers to repossessed assets $ 3,439 $ 2,287 $ 1,414
Transfers to investments (held-to-maturity) from trading account assets 33,258 ——
Transfers to investments (available-for-sale) from trading account assets 4,654 ——
Transfers to loans held for investment (loans) from loans held-for-sale 15,891 ——
(1) Reclassified to conform to the current period’s presentation.
See Notes to the Consolidated Financial Statements.
120