Citibank 2015 Annual Report Download - page 99
Download and view the complete annual report
Please find page 99 of the 2015 Citibank annual report below. You can navigate through the pages in the report by either clicking on the pages listed below, or by using the keyword search tool below to find specific information within the annual report.-
 1
1 -
2
-
3
-
4
-
5
-
6
-
7
-
8
-
9
-
10
-
11
-
12
-
13
-
14
-
15
-
16
-
17
-
18
-
19
-
20
-
21
-
22
-
23
-
24
-
25
-
26
-
27
-
28
-
29
-
30
-
31
-
32
-
33
-
34
-
35
-
36
-
37
-
38
-
39
-
40
-
41
-
42
-
43
-
44
-
45
-
46
-
47
-
48
-
49
-
50
-
51
-
52
-
53
-
54
-
55
-
56
-
57
-
58
-
59
-
60
-
61
-
62
-
63
-
64
-
65
-
66
-
67
-
68
-
69
-
70
-
71
-
72
-
73
-
74
-
75
-
76
-
77
-
78
-
79
-
80
-
81
-
82
-
83
-
84
-
85
-
86
-
87
-
88
-
 89
89 -
 90
90 -
 91
91 -
 92
92 -
 93
93 -
 94
94 -
 95
95 -
 96
96 -
 97
97 -
 98
98 -
 99
99 -
 100
100 -
 101
101 -
 102
102 -
 103
103 -
 104
104 -
 105
105 -
 106
106 -
 107
107 -
 108
108 -
 109
109 -
110
-
111
-
112
-
113
-
114
-
115
-
116
-
117
-
118
-
119
-
120
-
121
-
122
-
123
-
124
-
125
-
126
-
127
-
128
-
129
-
130
-
131
-
132
-
133
-
134
-
135
-
136
-
137
-
138
-
139
-
140
-
141
-
142
-
143
-
144
-
145
-
146
-
147
-
148
-
149
-
150
-
151
-
152
-
153
-
154
-
155
-
156
-
157
-
158
-
159
-
160
-
161
-
162
-
163
-
164
-
165
-
166
-
167
-
168
-
169
-
170
-
171
-
172
-
173
-
174
-
175
-
176
-
177
-
178
-
179
-
180
-
181
-
182
-
183
-
184
-
185
-
186
-
187
-
188
-
189
-
190
-
191
-
192
-
193
-
194
-
195
-
196
-
197
-
198
-
199
-
200
-
201
-
202
-
203
-
204
-
205
-
206
-
207
-
208
-
209
-
210
-
211
-
212
-
213
-
214
-
215
-
216
-
217
-
218
-
219
-
220
-
221
-
222
-
223
-
224
-
225
-
226
-
227
-
228
-
229
-
230
-
231
-
232
-
233
-
234
-
235
-
236
-
237
-
238
-
239
-
240
-
241
-
242
-
243
-
244
-
245
-
246
-
247
-
248
-
249
-
250
-
251
-
252
-
253
-
254
-
255
-
256
-
257
-
258
-
259
-
260
-
261
-
262
-
263
-
264
-
265
-
266
-
267
-
268
-
269
-
270
-
271
-
272
-
273
-
274
-
275
-
276
-
277
-
278
-
279
-
280
-
281
-
282
-
283
-
284
-
285
-
286
-
287
-
288
-
289
-
290
-
291
-
292
-
293
-
294
-
295
-
296
-
297
-
298
-
299
-
300
-
301
-
302
-
303
-
304
-
305
-
306
-
307
-
308
-
309
-
310
-
311
-
312
-
313
-
314
-
315
-
316
-
317
-
318
-
319
-
320
-
321
-
322
-
323
-
324
-
325
-
326
-
327
-
328
-
329
-
330
-
331
-
332
 |
 |

81
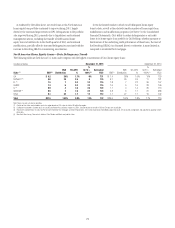
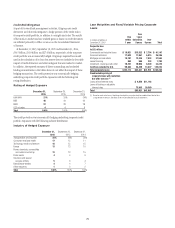
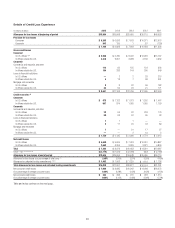
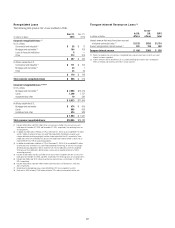
Details of Credit Loss Experience
In millions of dollars 2015 2014 2013 2012 2011
Allowance for loan losses at beginning of period $15,994 $19,648 $25,455 $30,115 $40,655
Provision for loan losses
Consumer $ 6,265 $ 6,693 $ 7,603 $10,371 $12,075
Corporate 843 135 1 87 (739)
$ 7,108 $ 6,828 $ 7,604 $10,458 $11,336
Gross credit losses
Consumer
In U.S. offices (1)(2) $ 5,500 $ 6,780 $ 8,402 $12,226 $15,767
In offices outside the U.S. 3,210 3,901 3,998 4,139 4,932
Corporate
Commercial and industrial, and other
In U.S. offices 112 66 125 154 392
In offices outside the U.S. 164 283 144 305 649
Loans to financial institutions
In U.S. offices —2 2 33 215
In offices outside the U.S. 413 7 68 391
Mortgage and real estate
In U.S. offices 88 62 59 182
In offices outside the U.S. 43 55 29 21 171
$ 9,041 $11,108 $12,769 $17,005 $22,699
Credit recoveries (3)
Consumer
In U.S. offices $ 975 $ 1,122 $ 1,073 $ 1,302 $ 1,467
In offices outside the U.S. 667 874 1,065 1,055 1,159
Corporate
Commercial and industrial, and other
In U.S. offices 22 64 62 243 175
In offices outside the U.S. 59 63 52 95 93
Loans to financial institutions
In U.S. offices 71 1 — —
In offices outside the U.S. 211 20 43 89
Mortgage and real estate
In U.S. offices 7— 31 17 27
In offices outside the U.S. —— 2 19 2
$ 1,739 $ 2,135 $ 2,306 $ 2,774 $ 3,012
Net credit losses
In U.S. offices $ 4,609 $ 5,669 $ 7,424 $10,910 $14,887
In offices outside the U.S. 2,693 3,304 3,039 3,321 4,800
Total $ 7,302 $ 8,973 $10,463 $14,231 $19,687
Other—net (4)(5)(6)(7)(8)(9)(10) $ (3,174) $ (1,509) $ (2,948) (887) $ (2,189)
Allowance for loan losses at end of period $12,626 $15,994 $19,648 $25,455 $30,115
Allowance for loan losses as a percentage of total loans (11) 2.06% 2.50% 2.97% 3.92% 4.69%
Allowance for unfunded lending commitments (10)(12) $ 1,402 $ 1,063 $ 1,229 $ 1,119 $ 1,136
Total allowance for loan losses and unfunded lending commitments $14,028 $17,057 $20,877 $26,574 $31,251
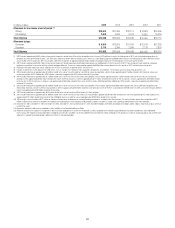
Net consumer credit losses $ 7,068 $ 8,685 $10,262 $14,008 $18,073
As a percentage of average consumer loans 2.06% 2.28% 2.63% 3.43% 4.15%
Net corporate credit losses $ 234 $ 288 $ 201 $ 223 $ 1,614
As a percentage of average corporate loans 0.08% 0.10% 0.08% 0.09% 0.79%
Table and notes continue on the next page.