Citibank 2015 Annual Report Download - page 180
Download and view the complete annual report
Please find page 180 of the 2015 Citibank annual report below. You can navigate through the pages in the report by either clicking on the pages listed below, or by using the keyword search tool below to find specific information within the annual report.-
 1
1 -
2
-
3
-
4
-
5
-
6
-
7
-
8
-
9
-
10
-
11
-
12
-
13
-
14
-
15
-
16
-
17
-
18
-
19
-
20
-
21
-
22
-
23
-
24
-
25
-
26
-
27
-
28
-
29
-
30
-
31
-
32
-
33
-
34
-
35
-
36
-
37
-
38
-
39
-
40
-
41
-
42
-
43
-
44
-
45
-
46
-
47
-
48
-
49
-
50
-
51
-
52
-
53
-
54
-
55
-
56
-
57
-
58
-
59
-
60
-
61
-
62
-
63
-
64
-
65
-
66
-
67
-
68
-
69
-
70
-
71
-
72
-
73
-
74
-
75
-
76
-
77
-
78
-
79
-
80
-
81
-
82
-
83
-
84
-
85
-
86
-
87
-
88
-
89
-
90
-
91
-
92
-
93
-
94
-
95
-
96
-
97
-
98
-
99
-
100
-
101
-
102
-
103
-
104
-
105
-
106
-
107
-
108
-
109
-
110
-
111
-
112
-
113
-
114
-
115
-
116
-
117
-
118
-
119
-
120
-
121
-
122
-
123
-
124
-
125
-
126
-
127
-
128
-
129
-
130
-
131
-
132
-
133
-
134
-
135
-
136
-
137
-
138
-
139
-
140
-
141
-
142
-
143
-
144
-
145
-
146
-
147
-
148
-
149
-
150
-
151
-
152
-
153
-
154
-
155
-
156
-
157
-
158
-
159
-
160
-
161
-
162
-
163
-
164
-
165
-
166
-
167
-
168
-
169
-
 170
170 -
 171
171 -
 172
172 -
 173
173 -
 174
174 -
 175
175 -
 176
176 -
 177
177 -
 178
178 -
 179
179 -
 180
180 -
 181
181 -
 182
182 -
 183
183 -
 184
184 -
 185
185 -
 186
186 -
 187
187 -
 188
188 -
 189
189 -
 190
190 -
191
-
192
-
193
-
194
-
195
-
196
-
197
-
198
-
199
-
200
-
201
-
202
-
203
-
204
-
205
-
206
-
207
-
208
-
209
-
210
-
211
-
212
-
213
-
214
-
215
-
216
-
217
-
218
-
219
-
220
-
221
-
222
-
223
-
224
-
225
-
226
-
227
-
228
-
229
-
230
-
231
-
232
-
233
-
234
-
235
-
236
-
237
-
238
-
239
-
240
-
241
-
242
-
243
-
244
-
245
-
246
-
247
-
248
-
249
-
250
-
251
-
252
-
253
-
254
-
255
-
256
-
257
-
258
-
259
-
260
-
261
-
262
-
263
-
264
-
265
-
266
-
267
-
268
-
269
-
270
-
271
-
272
-
273
-
274
-
275
-
276
-
277
-
278
-
279
-
280
-
281
-
282
-
283
-
284
-
285
-
286
-
287
-
288
-
289
-
290
-
291
-
292
-
293
-
294
-
295
-
296
-
297
-
298
-
299
-
300
-
301
-
302
-
303
-
304
-
305
-
306
-
307
-
308
-
309
-
310
-
311
-
312
-
313
-
314
-
315
-
316
-
317
-
318
-
319
-
320
-
321
-
322
-
323
-
324
-
325
-
326
-
327
-
328
-
329
-
330
-
331
-
332
 |
 |

162
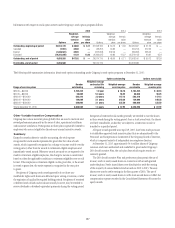
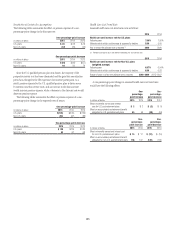
The following table shows the change in Accumulated other comprehensive income (loss) related to Company’s pension and postretirement benefit plans
(for Significant Plans and All Other Plans) for the years indicated.
In millions of dollars 2015 2014 2013
Beginning of year balance, net of tax (1)(2) $(5,159) $(3,989) $(5,270)
Cumulative effect of change in accounting policy (3) —— (22)
Actuarial assumptions changes and plan experience (4) 898 (3,404) 2,380
Net asset gain (loss) due to difference between actual and expected returns (1,457) 833 (1,084)
Net amortizations 236 202 271
Prior service (cost) credit (6) 13 360
Curtailment/settlement gain (5) 57 67 —
Foreign exchange impact and other 291 459 74
Change in deferred taxes, net 24 660 (698)
Change, net of tax $ 43 $(1,170) $ 1,281
End of year balance, net of tax (1)(2) $(5,116) $(5,159) $(3,989)
(1) See Note 20 to the Consolidated Financial Statements for further discussion of net Accumulated other comprehensive income (loss) balance.
(2) Includes net-of-tax amounts for certain profit sharing plans outside the U.S.
(3) Represents the cumulative effect of the change in accounting policy due to adoption of quarterly measurement for Significant Plans.
(4) Includes $46 million, $(111) million and $58 million of actuarial gains (losses) related to the U.S. nonqualified pension plans for 2015, 2014 and 2013, respectively.
(5) Curtailment and settlement gains relate to repositioning and divestiture activities.
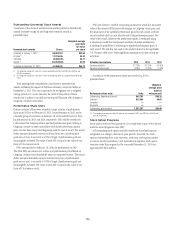
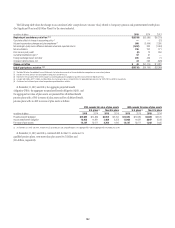
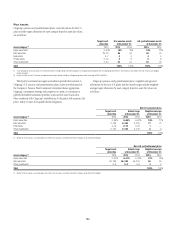
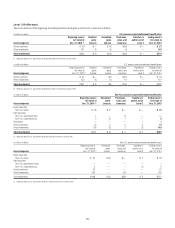
At December 31, 2015 and 2014, the aggregate projected benefit
obligation (PBO), the aggregate accumulated benefit obligation (ABO), and
the aggregate fair value of plan assets are presented for all defined benefit
pension plans with a PBO in excess of plan assets and for all defined benefit
pension plans with an ABO in excess of plan assets as follows:
PBO exceeds fair value of plan assets ABO exceeds fair value of plan assets
U.S. plans (1) Non-U.S. plans U.S. plans (1) Non-U.S. plans
In millions of dollars 2015 2014 2015 2014 2015 2014 2015 2014
Projected benefit obligation $13,943 $14,839 $3,918 $2,756 $13,943 $14,839 $2,369 $2,570
Accumulated benefit obligation 13,932 14,821 3,488 2,353 13,932 14,821 2,047 2,233
Fair value of plan assets 12,137 13,071 2,762 1,640 12,137 13,071 1,243 1,495
(1) At December 31, 2015 and 2014, for both the U.S. qualified plan and nonqualified plans, the aggregate PBO and the aggregate ABO exceeded plan assets.
At December 31, 2015 and 2014, combined ABO for the U.S. and non-U.S.
qualified pension plans, were more than plan assets by $1 billion and
$0.6 billion, respectively.