Citibank 2015 Annual Report Download - page 272
Download and view the complete annual report
Please find page 272 of the 2015 Citibank annual report below. You can navigate through the pages in the report by either clicking on the pages listed below, or by using the keyword search tool below to find specific information within the annual report.-
 1
1 -
2
-
3
-
4
-
5
-
6
-
7
-
8
-
9
-
10
-
11
-
12
-
13
-
14
-
15
-
16
-
17
-
18
-
19
-
20
-
21
-
22
-
23
-
24
-
25
-
26
-
27
-
28
-
29
-
30
-
31
-
32
-
33
-
34
-
35
-
36
-
37
-
38
-
39
-
40
-
41
-
42
-
43
-
44
-
45
-
46
-
47
-
48
-
49
-
50
-
51
-
52
-
53
-
54
-
55
-
56
-
57
-
58
-
59
-
60
-
61
-
62
-
63
-
64
-
65
-
66
-
67
-
68
-
69
-
70
-
71
-
72
-
73
-
74
-
75
-
76
-
77
-
78
-
79
-
80
-
81
-
82
-
83
-
84
-
85
-
86
-
87
-
88
-
89
-
90
-
91
-
92
-
93
-
94
-
95
-
96
-
97
-
98
-
99
-
100
-
101
-
102
-
103
-
104
-
105
-
106
-
107
-
108
-
109
-
110
-
111
-
112
-
113
-
114
-
115
-
116
-
117
-
118
-
119
-
120
-
121
-
122
-
123
-
124
-
125
-
126
-
127
-
128
-
129
-
130
-
131
-
132
-
133
-
134
-
135
-
136
-
137
-
138
-
139
-
140
-
141
-
142
-
143
-
144
-
145
-
146
-
147
-
148
-
149
-
150
-
151
-
152
-
153
-
154
-
155
-
156
-
157
-
158
-
159
-
160
-
161
-
162
-
163
-
164
-
165
-
166
-
167
-
168
-
169
-
170
-
171
-
172
-
173
-
174
-
175
-
176
-
177
-
178
-
179
-
180
-
181
-
182
-
183
-
184
-
185
-
186
-
187
-
188
-
189
-
190
-
191
-
192
-
193
-
194
-
195
-
196
-
197
-
198
-
199
-
200
-
201
-
202
-
203
-
204
-
205
-
206
-
207
-
208
-
209
-
210
-
211
-
212
-
213
-
214
-
215
-
216
-
217
-
218
-
219
-
220
-
221
-
222
-
223
-
224
-
225
-
226
-
227
-
228
-
229
-
230
-
231
-
232
-
233
-
234
-
235
-
236
-
237
-
238
-
239
-
240
-
241
-
242
-
243
-
244
-
245
-
246
-
247
-
248
-
249
-
250
-
251
-
252
-
253
-
254
-
255
-
256
-
257
-
258
-
259
-
260
-
261
-
 262
262 -
 263
263 -
 264
264 -
 265
265 -
 266
266 -
 267
267 -
 268
268 -
 269
269 -
 270
270 -
 271
271 -
 272
272 -
 273
273 -
 274
274 -
 275
275 -
 276
276 -
 277
277 -
 278
278 -
 279
279 -
 280
280 -
 281
281 -
 282
282 -
283
-
284
-
285
-
286
-
287
-
288
-
289
-
290
-
291
-
292
-
293
-
294
-
295
-
296
-
297
-
298
-
299
-
300
-
301
-
302
-
303
-
304
-
305
-
306
-
307
-
308
-
309
-
310
-
311
-
312
-
313
-
314
-
315
-
316
-
317
-
318
-
319
-
320
-
321
-
322
-
323
-
324
-
325
-
326
-
327
-
328
-
329
-
330
-
331
-
332
 |
 |

254
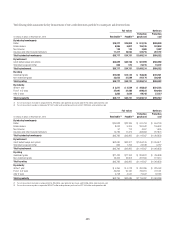
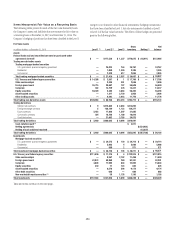
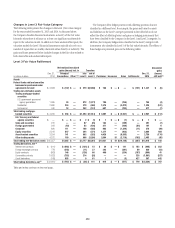
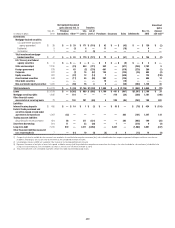
Items Measured at Fair Value on a Recurring Basis
The following tables present for each of the fair value hierarchy levels
the Company’s assets and liabilities that are measured at fair value on
a recurring basis at December 31, 2015 and December 31, 2014. The
Company’s hedging of positions that have been classified in the Level 3
category is not limited to other financial instruments (hedging instruments)
that have been classified as Level 3, but also instruments classified as Level 1
or Level 2 of the fair value hierarchy. The effects of these hedges are presented
gross in the following tables:
Fair Value Levels
In millions of dollars at December 31, 2015 Level 1 (1) Level 2 (1) Level 3
Gross
inventory Netting (2)
Net
balance
Assets
Federal funds sold and securities borrowed or purchased under
agreements to resell $ — $177,538 $ 1,337 $178,875 $ (40,911) $137,964
Trading non-derivative assets
Trading mortgage-backed securities
U.S. government-sponsored agency guaranteed — 24,023 744 24,767 — 24,767
Residential — 1,059 1,326 2,385 — 2,385
Commercial — 2,338 517 2,855 — 2,855
Total trading mortgage-backed securities $ — $ 27,420 $ 2,587 $ 30,007 $ — $ 30,007
U.S. Treasury and federal agency securities $ 14,208 $ 3,587 $ 1 $ 17,796 $ — $ 17,796
State and municipal — 2,345 351 2,696 — 2,696
Foreign government 35,715 20,697 197 56,609 — 56,609
Corporate 302 13,759 376 14,437 — 14,437
Equity securities 50,429 2,382 3,684 56,495 — 56,495
Asset-backed securities — 1,217 2,739 3,956 — 3,956
Other trading assets — 9,293 2,483 11,776 — 11,776
Total trading non-derivative assets $100,654 $ 80,700 $12,418 $193,772 $ — $193,772
Trading derivatives
Interest rate contracts $ 9 $412,802 $ 2,083 $414,894
Foreign exchange contracts 5 128,189 1,123 129,317
Equity contracts 2,422 17,866 1,597 21,885
Commodity contracts 204 16,706 1,100 18,010
Credit derivatives — 31,082 3,793 34,875
Total trading derivatives $ 2,640 $606,645 $ 9,696 $618,981
Cash collateral paid (3) $ 4,911
Netting agreements $(524,481)
Netting of cash collateral received (43,227)
Total trading derivatives $ 2,640 $606,645 $ 9,696 $623,892 $(567,708) $ 56,184
Investments
Mortgage-backed securities
U.S. government-sponsored agency guaranteed $ — $ 39,575 $ 139 $ 39,714 $ — $ 39,714
Residential — 5,982 4 5,986 — 5,986
Commercial — 569 2 571 — 571
Total investment mortgage-backed securities $ — $ 46,126 $ 145 $ 46,271 $ — $ 46,271
U.S. Treasury and federal agency securities $111,536 $ 11,375 $ 4 $122,915 $ — $122,915
State and municipal — 9,267 2,192 11,459 — 11,459
Foreign government 42,073 49,868 260 92,201 — 92,201
Corporate 3,605 11,595 603 15,803 — 15,803
Equity securities 430 71 124 625 — 625
Asset-backed securities — 8,578 596 9,174 — 9,174
Other debt securities — 688 — 688 — 688
Non-marketable equity securities (4) — 58 1,135 1,193 — 1,193
Total investments $157,644 $137,626 $ 5,059 $300,329 $ — $300,329
Table and notes continue on the next page.