Citibank 2015 Annual Report Download - page 41
Download and view the complete annual report
Please find page 41 of the 2015 Citibank annual report below. You can navigate through the pages in the report by either clicking on the pages listed below, or by using the keyword search tool below to find specific information within the annual report.-
 1
1 -
2
-
3
-
4
-
5
-
6
-
7
-
8
-
9
-
10
-
11
-
12
-
13
-
14
-
15
-
16
-
17
-
18
-
19
-
20
-
21
-
22
-
23
-
24
-
25
-
26
-
27
-
28
-
29
-
30
-
 31
31 -
 32
32 -
 33
33 -
 34
34 -
 35
35 -
 36
36 -
 37
37 -
 38
38 -
 39
39 -
 40
40 -
 41
41 -
 42
42 -
 43
43 -
 44
44 -
 45
45 -
 46
46 -
 47
47 -
 48
48 -
 49
49 -
 50
50 -
 51
51 -
52
-
53
-
54
-
55
-
56
-
57
-
58
-
59
-
60
-
61
-
62
-
63
-
64
-
65
-
66
-
67
-
68
-
69
-
70
-
71
-
72
-
73
-
74
-
75
-
76
-
77
-
78
-
79
-
80
-
81
-
82
-
83
-
84
-
85
-
86
-
87
-
88
-
89
-
90
-
91
-
92
-
93
-
94
-
95
-
96
-
97
-
98
-
99
-
100
-
101
-
102
-
103
-
104
-
105
-
106
-
107
-
108
-
109
-
110
-
111
-
112
-
113
-
114
-
115
-
116
-
117
-
118
-
119
-
120
-
121
-
122
-
123
-
124
-
125
-
126
-
127
-
128
-
129
-
130
-
131
-
132
-
133
-
134
-
135
-
136
-
137
-
138
-
139
-
140
-
141
-
142
-
143
-
144
-
145
-
146
-
147
-
148
-
149
-
150
-
151
-
152
-
153
-
154
-
155
-
156
-
157
-
158
-
159
-
160
-
161
-
162
-
163
-
164
-
165
-
166
-
167
-
168
-
169
-
170
-
171
-
172
-
173
-
174
-
175
-
176
-
177
-
178
-
179
-
180
-
181
-
182
-
183
-
184
-
185
-
186
-
187
-
188
-
189
-
190
-
191
-
192
-
193
-
194
-
195
-
196
-
197
-
198
-
199
-
200
-
201
-
202
-
203
-
204
-
205
-
206
-
207
-
208
-
209
-
210
-
211
-
212
-
213
-
214
-
215
-
216
-
217
-
218
-
219
-
220
-
221
-
222
-
223
-
224
-
225
-
226
-
227
-
228
-
229
-
230
-
231
-
232
-
233
-
234
-
235
-
236
-
237
-
238
-
239
-
240
-
241
-
242
-
243
-
244
-
245
-
246
-
247
-
248
-
249
-
250
-
251
-
252
-
253
-
254
-
255
-
256
-
257
-
258
-
259
-
260
-
261
-
262
-
263
-
264
-
265
-
266
-
267
-
268
-
269
-
270
-
271
-
272
-
273
-
274
-
275
-
276
-
277
-
278
-
279
-
280
-
281
-
282
-
283
-
284
-
285
-
286
-
287
-
288
-
289
-
290
-
291
-
292
-
293
-
294
-
295
-
296
-
297
-
298
-
299
-
300
-
301
-
302
-
303
-
304
-
305
-
306
-
307
-
308
-
309
-
310
-
311
-
312
-
313
-
314
-
315
-
316
-
317
-
318
-
319
-
320
-
321
-
322
-
323
-
324
-
325
-
326
-
327
-
328
-
329
-
330
-
331
-
332
 |
 |
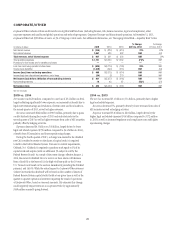
23
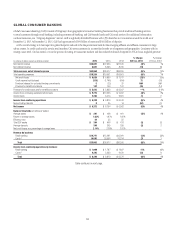
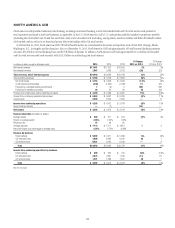
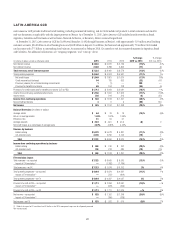
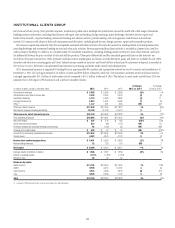
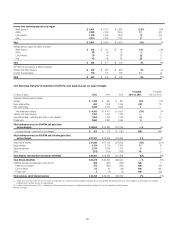
The discussion of the results of operations for Asia GCB below excludes the impact of FX translation for all periods presented. Presentations of the results
of operations, excluding the impact of FX translation, are non-GAAP financial measures. For a reconciliation of certain of these metrics to the reported
results, see the table above.
2015 vs. 2014
Net income decreased 2%, primarily due to lower revenues, partially offset by
lower expenses.
Revenues decreased 3%, primarily due to an industry-wide slowdown in
investment sales, particularly in the second half of 2015, as well as spread
compression and higher payment rates and the ongoing impact of regulatory
changes in cards, partially offset by volume growth.
Retail banking revenues decreased 2%, mainly due to a decline in
investment sales revenue, particularly in Taiwan, Singapore, India, Korea
and Indonesia, reflecting weaker customer confidence due to slowing
economic growth and volatility in the capital markets, as well as spread
compression, particularly in Poland. This decline in revenues was partially
offset by higher volumes, driven by lending (2% increase in average loans),
deposit products (5% increase in average deposits) and higher insurance
fee revenues. Citi expects investment sales revenues could continue to be
challenged in 2016, depending upon overall consumer sentiment, economic
growth and the capital markets environment in the region.
Cards revenues decreased 5%, primarily due to spread compression,
including continued high payment rates, and the ongoing impact of
regulatory changes, particularly in Singapore, Taiwan, Australia, Malaysia
and Poland, partially offset by modest volume growth (a 3% increase in
average loans and a 5% increase in purchase sales). Cards revenues were also
impacted by the weaker customer confidence, primarily in the second half
of 2015. Spread compression and regulatory changes will likely continue to
have a negative impact on cards revenues in the near term.
Expenses decreased 4%, primarily due to the absence of repositioning
charges in Korea in 2014 and efficiency savings, partially offset by higher
regulatory and compliance costs, investment spending, volume-related
growth and compensation expense.
Provisions decreased 1%, primarily due to higher loan loss reserve
releases, largely offset by an increase in net credit losses related to the
consumer business in Russia due to a deterioration in the economic
environment. Overall credit quality remained stable across the region
during 2015.
2014 vs. 2013
Net income decreased 8%, primarily due to higher expenses, partially offset
by lower credit costs and higher revenues.
Revenues increased 2%, reflecting higher retail banking revenues,
partially offset by lower cards revenues. Retail banking revenues increased
4%, due to higher insurance fee revenues and volume growth (average
retail loans increased 8% and average retail deposits increased 2%),
partially offset by the ongoing impact of regulatory changes and continued
spread compression.
Cards revenues decreased 1%, due to the impact of regulatory changes,
particularly in Korea, Indonesia and Singapore, spread compression and
customer deleveraging, largely offset by a 2% increase in average loans and
a 3% increase in purchase sales driven by growth in China, India, Singapore
and Hong Kong.
Expenses increased 7%, primarily due to higher repositioning charges in
Korea, investment spending and volume-related growth, partially offset by
higher efficiency savings.
Provisions decreased 9%, primarily due to higher overall loan loss reserve
releases, partially offset by a loan loss reserve build related to the consumer
business in Russia.