Citibank 2015 Annual Report Download - page 65
Download and view the complete annual report
Please find page 65 of the 2015 Citibank annual report below. You can navigate through the pages in the report by either clicking on the pages listed below, or by using the keyword search tool below to find specific information within the annual report.-
 1
1 -
2
-
3
-
4
-
5
-
6
-
7
-
8
-
9
-
10
-
11
-
12
-
13
-
14
-
15
-
16
-
17
-
18
-
19
-
20
-
21
-
22
-
23
-
24
-
25
-
26
-
27
-
28
-
29
-
30
-
31
-
32
-
33
-
34
-
35
-
36
-
37
-
38
-
39
-
40
-
41
-
42
-
43
-
44
-
45
-
46
-
47
-
48
-
49
-
50
-
51
-
52
-
53
-
54
-
 55
55 -
 56
56 -
 57
57 -
 58
58 -
 59
59 -
 60
60 -
 61
61 -
 62
62 -
 63
63 -
 64
64 -
 65
65 -
 66
66 -
 67
67 -
 68
68 -
 69
69 -
 70
70 -
 71
71 -
 72
72 -
 73
73 -
 74
74 -
 75
75 -
76
-
77
-
78
-
79
-
80
-
81
-
82
-
83
-
84
-
85
-
86
-
87
-
88
-
89
-
90
-
91
-
92
-
93
-
94
-
95
-
96
-
97
-
98
-
99
-
100
-
101
-
102
-
103
-
104
-
105
-
106
-
107
-
108
-
109
-
110
-
111
-
112
-
113
-
114
-
115
-
116
-
117
-
118
-
119
-
120
-
121
-
122
-
123
-
124
-
125
-
126
-
127
-
128
-
129
-
130
-
131
-
132
-
133
-
134
-
135
-
136
-
137
-
138
-
139
-
140
-
141
-
142
-
143
-
144
-
145
-
146
-
147
-
148
-
149
-
150
-
151
-
152
-
153
-
154
-
155
-
156
-
157
-
158
-
159
-
160
-
161
-
162
-
163
-
164
-
165
-
166
-
167
-
168
-
169
-
170
-
171
-
172
-
173
-
174
-
175
-
176
-
177
-
178
-
179
-
180
-
181
-
182
-
183
-
184
-
185
-
186
-
187
-
188
-
189
-
190
-
191
-
192
-
193
-
194
-
195
-
196
-
197
-
198
-
199
-
200
-
201
-
202
-
203
-
204
-
205
-
206
-
207
-
208
-
209
-
210
-
211
-
212
-
213
-
214
-
215
-
216
-
217
-
218
-
219
-
220
-
221
-
222
-
223
-
224
-
225
-
226
-
227
-
228
-
229
-
230
-
231
-
232
-
233
-
234
-
235
-
236
-
237
-
238
-
239
-
240
-
241
-
242
-
243
-
244
-
245
-
246
-
247
-
248
-
249
-
250
-
251
-
252
-
253
-
254
-
255
-
256
-
257
-
258
-
259
-
260
-
261
-
262
-
263
-
264
-
265
-
266
-
267
-
268
-
269
-
270
-
271
-
272
-
273
-
274
-
275
-
276
-
277
-
278
-
279
-
280
-
281
-
282
-
283
-
284
-
285
-
286
-
287
-
288
-
289
-
290
-
291
-
292
-
293
-
294
-
295
-
296
-
297
-
298
-
299
-
300
-
301
-
302
-
303
-
304
-
305
-
306
-
307
-
308
-
309
-
310
-
311
-
312
-
313
-
314
-
315
-
316
-
317
-
318
-
319
-
320
-
321
-
322
-
323
-
324
-
325
-
326
-
327
-
328
-
329
-
330
-
331
-
332
 |
 |

47
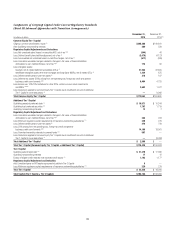
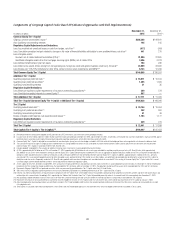
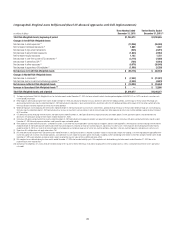
Citigroup Capital Rollforward Under Basel III (Advanced Approaches with Full Implementation)
In millions of dollars
Three Months Ended
December 31, 2015
Twelve Months Ended
December 31, 2015 (1)
Common Equity Tier 1 Capital
Balance, beginning of period $146,451 $136,597
Net income 3,335 17,242
Dividends declared (415) (1,253)
Treasury stock acquired (1,650) (5,452)
Net increase in additional paid-in capital (2) 331 1,036
Net increase in foreign currency translation adjustment net of hedges, net of tax (796) (5,499)
Net increase in unrealized losses on securities AFS, net of tax (1,131) (964)
Net change in defined benefit plans liability adjustment, net of tax (85) 43
Net change in cumulative unrealized net gain related to changes in fair value of
financial liabilities attributable to own creditworthiness, net of tax 276 (162)
Net change in goodwill, net of related deferred tax liabilities (DTLs) (248) 825
Net decrease in identifiable intangible assets other than mortgage servicing rights (MSRs), net of related DTLs 325 787
Net decrease in defined benefit pension plan net assets 110 142
Net increase in deferred tax assets (DTAs) arising from net operating loss, foreign tax credit and general business
credit carry-forwards (364) (33)
Net decrease in excess over 10%/15% limitations for other DTAs, certain common stock investments and MSRs 728 3,576
Other (2) (20)
Net increase in Common Equity Tier 1 Capital $ 414 $ 10,268
Common Equity Tier 1 Capital Balance, end of period $146,865 $146,865
Additional Tier 1 Capital
Balance, beginning of period $ 15,548 $ 11,469
Net increase in qualifying perpetual preferred stock (3) 1,495 6,227
Net decrease in qualifying trust preferred securities — (4)
Net change in permitted ownership interests in covered funds 111 (567)
Other 17 46
Net increase in Additional Tier 1 Capital $ 1,623 $ 5,702
Tier 1 Capital Balance, end of period $164,036 $164,036
Tier 2 Capital
Balance, beginning of period $ 21,097 $ 17,388
Net increase in qualifying subordinated debt 349 4,650
Net change in excess of eligible credit reserves over expected credit losses 606 (14)
Other 9 37
Net increase in Tier 2 Capital $ 964 $ 4,673
Tier 2 Capital Balance, end of period $ 22,061 $ 22,061
Total Capital (Tier 1 Capital + Tier 2 Capital) $186,097 $186,097
(1) The beginning balance of Common Equity Tier 1 Capital for the twelve months ended December 31, 2015 has been restated to reflect the retrospective adoption of ASU 2014-01 for LIHTC investments, consistent with
current period presentation.
(2) Primarily represents an increase in additional paid-in capital related to employee benefit plans.
(3) Citi issued approximately $1.5 billion and approximately $6.3 billion of qualifying perpetual preferred stock during the three and twelve months ended December 31, 2015, respectively, which were partially offset by
the netting of issuance costs of $4 million and $23 million during those respective periods.