Citibank 2015 Annual Report Download - page 319
Download and view the complete annual report
Please find page 319 of the 2015 Citibank annual report below. You can navigate through the pages in the report by either clicking on the pages listed below, or by using the keyword search tool below to find specific information within the annual report.-
 1
1 -
2
-
3
-
4
-
5
-
6
-
7
-
8
-
9
-
10
-
11
-
12
-
13
-
14
-
15
-
16
-
17
-
18
-
19
-
20
-
21
-
22
-
23
-
24
-
25
-
26
-
27
-
28
-
29
-
30
-
31
-
32
-
33
-
34
-
35
-
36
-
37
-
38
-
39
-
40
-
41
-
42
-
43
-
44
-
45
-
46
-
47
-
48
-
49
-
50
-
51
-
52
-
53
-
54
-
55
-
56
-
57
-
58
-
59
-
60
-
61
-
62
-
63
-
64
-
65
-
66
-
67
-
68
-
69
-
70
-
71
-
72
-
73
-
74
-
75
-
76
-
77
-
78
-
79
-
80
-
81
-
82
-
83
-
84
-
85
-
86
-
87
-
88
-
89
-
90
-
91
-
92
-
93
-
94
-
95
-
96
-
97
-
98
-
99
-
100
-
101
-
102
-
103
-
104
-
105
-
106
-
107
-
108
-
109
-
110
-
111
-
112
-
113
-
114
-
115
-
116
-
117
-
118
-
119
-
120
-
121
-
122
-
123
-
124
-
125
-
126
-
127
-
128
-
129
-
130
-
131
-
132
-
133
-
134
-
135
-
136
-
137
-
138
-
139
-
140
-
141
-
142
-
143
-
144
-
145
-
146
-
147
-
148
-
149
-
150
-
151
-
152
-
153
-
154
-
155
-
156
-
157
-
158
-
159
-
160
-
161
-
162
-
163
-
164
-
165
-
166
-
167
-
168
-
169
-
170
-
171
-
172
-
173
-
174
-
175
-
176
-
177
-
178
-
179
-
180
-
181
-
182
-
183
-
184
-
185
-
186
-
187
-
188
-
189
-
190
-
191
-
192
-
193
-
194
-
195
-
196
-
197
-
198
-
199
-
200
-
201
-
202
-
203
-
204
-
205
-
206
-
207
-
208
-
209
-
210
-
211
-
212
-
213
-
214
-
215
-
216
-
217
-
218
-
219
-
220
-
221
-
222
-
223
-
224
-
225
-
226
-
227
-
228
-
229
-
230
-
231
-
232
-
233
-
234
-
235
-
236
-
237
-
238
-
239
-
240
-
241
-
242
-
243
-
244
-
245
-
246
-
247
-
248
-
249
-
250
-
251
-
252
-
253
-
254
-
255
-
256
-
257
-
258
-
259
-
260
-
261
-
262
-
263
-
264
-
265
-
266
-
267
-
268
-
269
-
270
-
271
-
272
-
273
-
274
-
275
-
276
-
277
-
278
-
279
-
280
-
281
-
282
-
283
-
284
-
285
-
286
-
287
-
288
-
289
-
290
-
291
-
292
-
293
-
294
-
295
-
296
-
297
-
298
-
299
-
300
-
301
-
302
-
303
-
304
-
305
-
306
-
307
-
308
-
 309
309 -
 310
310 -
 311
311 -
 312
312 -
 313
313 -
 314
314 -
 315
315 -
 316
316 -
 317
317 -
 318
318 -
 319
319 -
 320
320 -
 321
321 -
 322
322 -
 323
323 -
 324
324 -
 325
325 -
 326
326 -
 327
327 -
 328
328 -
 329
329 -
330
-
331
-
332
 |
 |

301
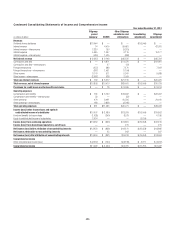
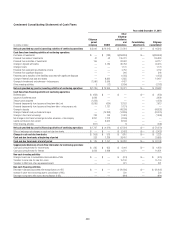
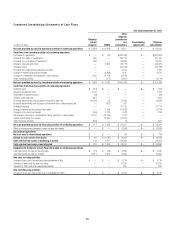
Condensed Consolidating Statements of Cash Flows
Year ended December 31, 2013
In millions of dollars
Citigroup
parent
company CGMHI
Other
Citigroup
subsidiaries
and
eliminations
Consolidating
adjustments
Citigroup
consolidated
Net cash provided by (used in) operating activities of continuing operations $ (7,881) $ (5,692) $ 76,817 $ — $ 63,244
Cash flows from investing activities of continuing operations
Purchases of investments $ — $ (34) $(220,789) $ — $(220,823)
Proceeds from sales of investments 385 — 130,715 — 131,100
Proceeds from maturities of investments 233 — 84,598 — 84,831
Change in deposits with banks — 6,242 (73,113) — (66,871)
Change in loans — — (30,198) — (30,198)
Proceeds from sales and securitizations of loans — — 9,123 — 9,123
Change in federal funds sold and resales — (2,838) 7,112 — 4,274
Changes in investments and advances—intercompany 7,226 (2,118) (5,108) — —
Other investing activities 4 (171) (2,607) — (2,774)
Net cash provided by (used in) investing activities of continuing operations $ 7,848 $ 1,081 $(100,267) $ — $ (91,338)
Cash flows from financing activities of continuing operations
Dividends paid $ (314) $ — $ — $ — $ (314)
Issuance of preferred stock 4,192 — — — 4,192
Redemption of preferred stock (94) — — — (94)
Treasury stock acquired (837) — — — (837)
Proceeds (repayments) from issuance of long-term debt, net (13,426) 53 3,784 — (9,589)
Proceeds (repayments) from issuance of long-term debt—intercompany, net — (202) 202 — —
Change in deposits — — 37,713 — 37,713
Change in federal funds purchased and repos — 2,768 (10,492) — (7,724)
Change in short-term borrowings (359) 1,130 (572) — 199
Net change in short-term borrowings and other advances—intercompany 11,402 (13,149) 1,747 — —
Capital contributions from parent — 12,330 (12,330) — —
Other financing activities (451) — (1) — (452)
Net cash provided by (used in) financing activities of continuing operations $ 113 $ 2,930 $ 20,051 $ — $ 23,094
Effect of exchange rate changes on cash and due from banks $ — $ — $ (1,558) $ — $ (1,558)
Discontinued operations —
Net cash used in discontinued operations $ — $ — $ (10) $ — $ (10)
Change in cash and due from banks $ 80 $ (1,681) $ (4,967) $ — $ (6,568)
Cash and due from banks at beginning of period 153 2,917 33,383 — 36,453
Cash and due from banks at end of period $ 233 $ 1,236 $ 28,416 $ — $ 29,885
Supplemental disclosure of cash flow information for continuing operations
Cash paid during the year for income taxes $ (71) $ (20) $ 4,586 $ — $ 4,495
Cash paid during the year for interest 6,514 2,575 6,566 — 15,655
Non-cash investing activities
Change in loans due to consolidation/deconsolidation of VIEs $ — $ — $ 6,718 $ — $ 6,718
Transfers to loans held-for-sale from loans — — 17,300 — 17,300
Transfers to OREO and other repossessed assets — — 325 — 325
Non-cash financing activities
Increase in short-term borrowings due to consolidation of VIEs $ — $ — $ 6,718 $ — $ 6,718