Citibank 2015 Annual Report Download - page 139
Download and view the complete annual report
Please find page 139 of the 2015 Citibank annual report below. You can navigate through the pages in the report by either clicking on the pages listed below, or by using the keyword search tool below to find specific information within the annual report.-
 1
1 -
2
-
3
-
4
-
5
-
6
-
7
-
8
-
9
-
10
-
11
-
12
-
13
-
14
-
15
-
16
-
17
-
18
-
19
-
20
-
21
-
22
-
23
-
24
-
25
-
26
-
27
-
28
-
29
-
30
-
31
-
32
-
33
-
34
-
35
-
36
-
37
-
38
-
39
-
40
-
41
-
42
-
43
-
44
-
45
-
46
-
47
-
48
-
49
-
50
-
51
-
52
-
53
-
54
-
55
-
56
-
57
-
58
-
59
-
60
-
61
-
62
-
63
-
64
-
65
-
66
-
67
-
68
-
69
-
70
-
71
-
72
-
73
-
74
-
75
-
76
-
77
-
78
-
79
-
80
-
81
-
82
-
83
-
84
-
85
-
86
-
87
-
88
-
89
-
90
-
91
-
92
-
93
-
94
-
95
-
96
-
97
-
98
-
99
-
100
-
101
-
102
-
103
-
104
-
105
-
106
-
107
-
108
-
109
-
110
-
111
-
112
-
113
-
114
-
115
-
116
-
117
-
118
-
119
-
120
-
121
-
122
-
123
-
124
-
125
-
126
-
127
-
128
-
 129
129 -
 130
130 -
 131
131 -
 132
132 -
 133
133 -
 134
134 -
 135
135 -
 136
136 -
 137
137 -
 138
138 -
 139
139 -
 140
140 -
 141
141 -
 142
142 -
 143
143 -
 144
144 -
 145
145 -
 146
146 -
 147
147 -
 148
148 -
 149
149 -
150
-
151
-
152
-
153
-
154
-
155
-
156
-
157
-
158
-
159
-
160
-
161
-
162
-
163
-
164
-
165
-
166
-
167
-
168
-
169
-
170
-
171
-
172
-
173
-
174
-
175
-
176
-
177
-
178
-
179
-
180
-
181
-
182
-
183
-
184
-
185
-
186
-
187
-
188
-
189
-
190
-
191
-
192
-
193
-
194
-
195
-
196
-
197
-
198
-
199
-
200
-
201
-
202
-
203
-
204
-
205
-
206
-
207
-
208
-
209
-
210
-
211
-
212
-
213
-
214
-
215
-
216
-
217
-
218
-
219
-
220
-
221
-
222
-
223
-
224
-
225
-
226
-
227
-
228
-
229
-
230
-
231
-
232
-
233
-
234
-
235
-
236
-
237
-
238
-
239
-
240
-
241
-
242
-
243
-
244
-
245
-
246
-
247
-
248
-
249
-
250
-
251
-
252
-
253
-
254
-
255
-
256
-
257
-
258
-
259
-
260
-
261
-
262
-
263
-
264
-
265
-
266
-
267
-
268
-
269
-
270
-
271
-
272
-
273
-
274
-
275
-
276
-
277
-
278
-
279
-
280
-
281
-
282
-
283
-
284
-
285
-
286
-
287
-
288
-
289
-
290
-
291
-
292
-
293
-
294
-
295
-
296
-
297
-
298
-
299
-
300
-
301
-
302
-
303
-
304
-
305
-
306
-
307
-
308
-
309
-
310
-
311
-
312
-
313
-
314
-
315
-
316
-
317
-
318
-
319
-
320
-
321
-
322
-
323
-
324
-
325
-
326
-
327
-
328
-
329
-
330
-
331
-
332
 |
 |
121
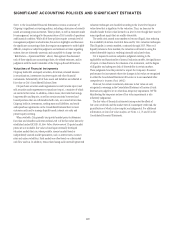
projections incorporate certain external economic projections developed at
the point in time the plan is developed. For the purpose of performing any
impairment test, the most recent three-year forecast available is updated by
Citi to reflect current economic conditions as of the testing date. Citi uses
the updated long-range financial forecasts as a basis for its annual goodwill
impairment test. Management may engage an independent valuation
specialist to assist in Citi’s valuation process.
Similar to the prior year, Citigroup engaged an independent valuation
specialist in 2015 to assist in Citi’s valuation for most of the reporting units
employing both the market approach and DCF method. Citi believes that
the DCF method, using management projections for the selected reporting
units and an appropriate risk-adjusted discount rate, is most reflective of
a market participant’s view of fair values given current market conditions.
For reporting units where both methods were utilized in 2015, the resulting
fair values were relatively consistent and appropriate weighting was given to
outputs from both methods.
The DCF method used at the time of each impairment test used discount
rates that Citi believes adequately reflected the risk and uncertainty in the
financial markets in the internally generated cash flow projections. The DCF
method employs a capital asset pricing model in estimating the discount
rate. Citi continues to value the remaining reporting units where it believes
the risk of impairment to be low, using primarily the market approach.
Since none of the Company’s reporting units are publicly traded,
individual reporting unit fair-value determinations cannot be directly
correlated to Citigroup’s common stock price. The sum of the fair values of
the reporting units at July 1, 2015 exceeded the overall market capitalization
of Citi as of July 1, 2015. However, Citi believes that it is not meaningful to
reconcile the sum of the fair values of the Company’s reporting units to its
market capitalization due to several factors. The market capitalization of
Citigroup reflects the execution risk in a transaction involving Citigroup due
to its size. However, the individual reporting units’ fair values are not subject
to the same level of execution risk or a business model that is perceived to be
as complex.
See Note 17 to the Consolidated Financial Statements for additional
information on goodwill, including the changes in the goodwill balance
year-over-year and the reporting unit goodwill balances as of December 31, 2015.
Income Taxes
Overview
Citi is subject to the income tax laws of the U.S., its states and local
municipalities and the foreign jurisdictions in which Citi operates. These
tax laws are complex and are subject to differing interpretations by the
taxpayer and the relevant governmental taxing authorities. Disputes over
interpretations of the tax laws may be subject to review and adjudication by
the court systems of the various tax jurisdictions or may be settled with the
taxing authority upon audit.
In establishing a provision for income tax expense, Citi must make
judgments and interpretations about the application of these inherently
complex tax laws. Citi must also make estimates about when in the future
certain items will affect taxable income in the various tax jurisdictions, both
domestic and foreign. Deferred taxes are recorded for the future consequences
of events that have been recognized in the financial statements or tax
returns, based upon enacted tax laws and rates. Deferred tax assets (DTAs)
are recognized subject to management’s judgment that realization is more-
likely-than-not.
DTAs
At December 31, 2015, Citi had recorded net DTAs of $47.8 billion. In
the fourth quarter of 2015, Citi’s DTAs increased $600 million, driven by
movements in AOCI, partially offset by earnings. On a full-year basis, Citi’s
DTAs decreased $1.5 billion from $49.3 billion at December 31, 2014. The
decrease in total DTAs year-over-year was primarily due to the earnings in
Citicorp and Citi Holdings partially offset by an increase in AOCI.
Foreign tax credits (FTCs) comprised approximately $15.9 billion of Citi’s
DTAs as of December 31, 2015, compared to approximately $17.6 billion as
of December 31, 2014. The decrease in FTCs year-over-year was due to the
generation of U.S. taxable income and represented $1.7 billion of the $1.5
billion decrease in Citi’s overall DTAs noted above, partially offset by the
increase in the AOCI-related DTAs. The FTCs carry-forward periods represent
the most time-sensitive component of Citi’s DTAs. Accordingly, in 2016,
Citi will continue to prioritize reducing the FTC carry-forward component
of the DTAs. Secondarily, Citi’s actions will focus on reducing other DTA
components and, thereby, reduce the total DTAs. Citi’s DTAs will decline
primarily as additional domestic GAAP taxable income is generated.