Citibank 2015 Annual Report Download - page 48
Download and view the complete annual report
Please find page 48 of the 2015 Citibank annual report below. You can navigate through the pages in the report by either clicking on the pages listed below, or by using the keyword search tool below to find specific information within the annual report.-
 1
1 -
2
-
3
-
4
-
5
-
6
-
7
-
8
-
9
-
10
-
11
-
12
-
13
-
14
-
15
-
16
-
17
-
18
-
19
-
20
-
21
-
22
-
23
-
24
-
25
-
26
-
27
-
28
-
29
-
30
-
31
-
32
-
33
-
34
-
35
-
36
-
37
-
 38
38 -
 39
39 -
 40
40 -
 41
41 -
 42
42 -
 43
43 -
 44
44 -
 45
45 -
 46
46 -
 47
47 -
 48
48 -
 49
49 -
 50
50 -
 51
51 -
 52
52 -
 53
53 -
 54
54 -
 55
55 -
 56
56 -
 57
57 -
 58
58 -
59
-
60
-
61
-
62
-
63
-
64
-
65
-
66
-
67
-
68
-
69
-
70
-
71
-
72
-
73
-
74
-
75
-
76
-
77
-
78
-
79
-
80
-
81
-
82
-
83
-
84
-
85
-
86
-
87
-
88
-
89
-
90
-
91
-
92
-
93
-
94
-
95
-
96
-
97
-
98
-
99
-
100
-
101
-
102
-
103
-
104
-
105
-
106
-
107
-
108
-
109
-
110
-
111
-
112
-
113
-
114
-
115
-
116
-
117
-
118
-
119
-
120
-
121
-
122
-
123
-
124
-
125
-
126
-
127
-
128
-
129
-
130
-
131
-
132
-
133
-
134
-
135
-
136
-
137
-
138
-
139
-
140
-
141
-
142
-
143
-
144
-
145
-
146
-
147
-
148
-
149
-
150
-
151
-
152
-
153
-
154
-
155
-
156
-
157
-
158
-
159
-
160
-
161
-
162
-
163
-
164
-
165
-
166
-
167
-
168
-
169
-
170
-
171
-
172
-
173
-
174
-
175
-
176
-
177
-
178
-
179
-
180
-
181
-
182
-
183
-
184
-
185
-
186
-
187
-
188
-
189
-
190
-
191
-
192
-
193
-
194
-
195
-
196
-
197
-
198
-
199
-
200
-
201
-
202
-
203
-
204
-
205
-
206
-
207
-
208
-
209
-
210
-
211
-
212
-
213
-
214
-
215
-
216
-
217
-
218
-
219
-
220
-
221
-
222
-
223
-
224
-
225
-
226
-
227
-
228
-
229
-
230
-
231
-
232
-
233
-
234
-
235
-
236
-
237
-
238
-
239
-
240
-
241
-
242
-
243
-
244
-
245
-
246
-
247
-
248
-
249
-
250
-
251
-
252
-
253
-
254
-
255
-
256
-
257
-
258
-
259
-
260
-
261
-
262
-
263
-
264
-
265
-
266
-
267
-
268
-
269
-
270
-
271
-
272
-
273
-
274
-
275
-
276
-
277
-
278
-
279
-
280
-
281
-
282
-
283
-
284
-
285
-
286
-
287
-
288
-
289
-
290
-
291
-
292
-
293
-
294
-
295
-
296
-
297
-
298
-
299
-
300
-
301
-
302
-
303
-
304
-
305
-
306
-
307
-
308
-
309
-
310
-
311
-
312
-
313
-
314
-
315
-
316
-
317
-
318
-
319
-
320
-
321
-
322
-
323
-
324
-
325
-
326
-
327
-
328
-
329
-
330
-
331
-
332
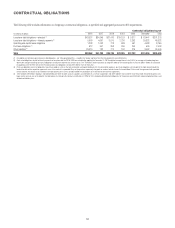
 |
 |
30
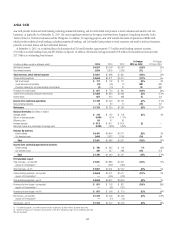
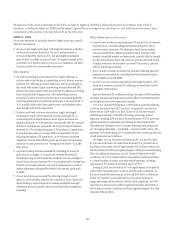
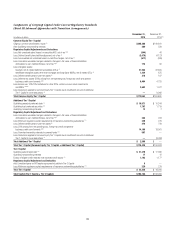
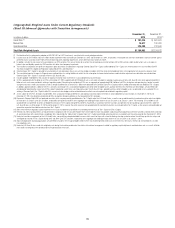
The discussion of the results of operations for Citi Holdings below excludes the impact of CVA/DVA for all periods presented. Presentations of the results
of operations, excluding the impact of CVA/DVA, are non-GAAP financial measures. Citi believes the presentation of Citi Holdings’ results excluding the
impact of CVA/DVA is a more meaningful depiction of the underlying fundamentals of the business. For a reconciliation of these metrics to the reported
results, see the table above.
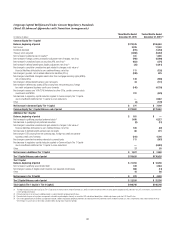
2015 vs. 2014
Net income was $1.1 billion, an improvement from a net loss of $3.5 billion
in 2014, largely due to the impact of the mortgage settlement in 2014 (see
“Executive Summary” above). Excluding the mortgage settlement, net
income increased $782 million, primarily due to lower expenses and lower net
credit losses, partially offset by a lower net loan loss reserve release. While Citi
Holdings expects to have positive net income during 2016, given the significant
asset sales and declines in overall Citi Holdings’ assets during 2015, it does not
expect to generate the same level of net income in 2016 as in 2015.
Revenues decreased 1%, primarily driven by the overall wind-down of
the portfolio, the impact of redemptions of high cost debt and the impact
of recording OneMain Financial net credit losses as a reduction of revenue
beginning in the second quarter of 2015, mostly offset by higher gains
on asset sales, including in the fourth quarter of 2015 due to the sales of
OneMain Financial and the retail banking and credit cards businesses
in Japan.
Expenses declined 52%. Excluding the impact of the mortgage settlement,
expenses declined 22%, primarily due to the ongoing decline in assets and lower
legal and related costs ($420 million compared to $986 million in 2014).
Provisions decreased 26%. Excluding the impact of the mortgage
settlement, provisions decreased 24%, driven by lower net credit losses,
partially offset by a lower net loss reserve release. Net credit losses declined
42%, primarily due to the impact of the recording of OneMain Financial net
credit losses as a reduction in revenue, continued improvements in North
America mortgages and overall lower asset levels. The net reserve release
decreased 42%. Excluding the impact of the mortgage settlement, the net
reserve release decreased 46% to $529 million, primarily due to lower releases
related to the North America mortgage portfolio as the portfolio has been
reduced and credit has improved.
2014 vs. 2013
The net loss increased by $1.6 billion to $3.5 billion, largely due to the
impact of the mortgage settlement, partially offset by higher revenues and
lower cost of credit. Excluding the mortgage settlement, net income increased
by $2.2 billion to $275 million, primarily due to lower expenses, lower net
credit losses and higher revenues, partially offset by a lower net loan loss
reserve release.
Revenues increased 17%, primarily driven by gains on asset sales,
including the sales of the consumer operations in Greece and Spain in the
third quarter of 2014, lower funding costs and the absence of residential
mortgage repurchase reserve builds for representation and warranty claims
as compared to 2013, partially offset by losses on the redemption of debt
associated with funding Citi Holdings assets.
Expenses increased 22%. Excluding the impact of the mortgage
settlement, expenses declined 25%, primarily driven by lower legal and
related costs ($986 million compared to $2.6 billion in 2013) as well as the
ongoing decline in assets.
Provisions decreased 16%. Excluding the impact of the mortgage
settlement, provisions declined 19%, driven by a 44% decline in net credit
losses primarily due to continued improvements in North America
mortgages and overall lower asset levels. The net reserve release decreased
55%. Excluding the impact of the mortgage settlement, the net reserve release
decreased 53%, primarily due to lower net releases related to the North
America mortgage portfolio, partially offset by lower losses on asset sales.
Payment Protection Insurance (PPI)
The selling of PPI by financial institutions in the U.K. has been the subject
of intense review and focus by U.K. regulators and, more recently, the U.K.
Supreme Court. For additional information on PPI, see “Citi Holdings” in
Citi’s Annual Report on Form 10-K for the year ended December 31, 2013
filed with the SEC on March 3, 2014.
PPI is designed to cover a customer’s loan repayments if certain events
occur, such as long-term illness or unemployment. The U.K. Financial
Conduct Authority (FCA) found certain problems across the industry with
how these products were sold, including customers not realizing that the cost
of PPI premiums was being added to their loan or PPI being unsuitable for
the customer. Redress generally involves the repayment of premiums and
the refund of all applicable contractual interest together with compensatory
interest of 8%. In addition, during the fourth quarter of 2014, the U.K.
Supreme Court issued a ruling in a case (Plevin) involving PPI pursuant to
which the court ruled, independent of the sale of the PPI contract, the PPI
contract at issue in the case was “unfair” due to the high sales commissions
earned and the lack of disclosure to the customer thereof.
During the fourth quarter of 2015, the FCA issued a consultation paper
that proposed (1) a deadline for PPI complaints (both non-Plevin and Plevin
complaints) of two years after the effective date of the final rules; (2) an
FCA-led customer communications campaign in advance of the deadline,
with bank funding of the campaign; and (3) a failure to disclose a sales
commission of 50% or more would be deemed unfair when assessing a new
PPI complaint and require a customer refund of the difference between the
commission paid and 50%, plus interest. Final rules are expected from the
FCA in spring 2016.
During 2015, Citi increased its PPI reserves by approximately
$153 million ($65 million of which was recorded in Citi Holdings and
$88 million of which was recorded in discontinued operations), including a
$106 million reserve increase in the fourth quarter of 2015 ($39 million of
which was recorded in Citi Holdings and $67 million of which was recorded
in discontinued operations). The increase for full year 2015 compared to
an increase of $118 million during 2014. While the overall level of claims
generally remained unchanged in 2015, the increase in the reserves during
2015, including in the fourth quarter of 2015, was due in part to the Plevin
case and the guidelines set forth in the FCA’s consultation paper, including
the proposed customer communications campaign.
Citi’s year-end 2015 PPI reserve was $262 million (compared to
$225 million as of December 31, 2014). Additional reserving actions,
if any, in 2016 will largely depend on the timing of and response to
the FCA’s final rules, including the level of customer response to any
communications campaign.