Citibank 2015 Annual Report Download - page 28
Download and view the complete annual report
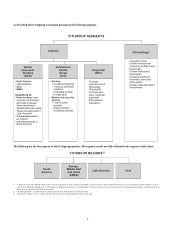
Please find page 28 of the 2015 Citibank annual report below. You can navigate through the pages in the report by either clicking on the pages listed below, or by using the keyword search tool below to find specific information within the annual report.-
 1
1 -
2
-
3
-
4
-
5
-
6
-
7
-
8
-
9
-
10
-
11
-
12
-
13
-
14
-
15
-
16
-
17
-
 18
18 -
 19
19 -
 20
20 -
 21
21 -
 22
22 -
 23
23 -
 24
24 -
 25
25 -
 26
26 -
 27
27 -
 28
28 -
 29
29 -
 30
30 -
 31
31 -
 32
32 -
 33
33 -
 34
34 -
 35
35 -
 36
36 -
 37
37 -
 38
38 -
39
-
40
-
41
-
42
-
43
-
44
-
45
-
46
-
47
-
48
-
49
-
50
-
51
-
52
-
53
-
54
-
55
-
56
-
57
-
58
-
59
-
60
-
61
-
62
-
63
-
64
-
65
-
66
-
67
-
68
-
69
-
70
-
71
-
72
-
73
-
74
-
75
-
76
-
77
-
78
-
79
-
80
-
81
-
82
-
83
-
84
-
85
-
86
-
87
-
88
-
89
-
90
-
91
-
92
-
93
-
94
-
95
-
96
-
97
-
98
-
99
-
100
-
101
-
102
-
103
-
104
-
105
-
106
-
107
-
108
-
109
-
110
-
111
-
112
-
113
-
114
-
115
-
116
-
117
-
118
-
119
-
120
-
121
-
122
-
123
-
124
-
125
-
126
-
127
-
128
-
129
-
130
-
131
-
132
-
133
-
134
-
135
-
136
-
137
-
138
-
139
-
140
-
141
-
142
-
143
-
144
-
145
-
146
-
147
-
148
-
149
-
150
-
151
-
152
-
153
-
154
-
155
-
156
-
157
-
158
-
159
-
160
-
161
-
162
-
163
-
164
-
165
-
166
-
167
-
168
-
169
-
170
-
171
-
172
-
173
-
174
-
175
-
176
-
177
-
178
-
179
-
180
-
181
-
182
-
183
-
184
-
185
-
186
-
187
-
188
-
189
-
190
-
191
-
192
-
193
-
194
-
195
-
196
-
197
-
198
-
199
-
200
-
201
-
202
-
203
-
204
-
205
-
206
-
207
-
208
-
209
-
210
-
211
-
212
-
213
-
214
-
215
-
216
-
217
-
218
-
219
-
220
-
221
-
222
-
223
-
224
-
225
-
226
-
227
-
228
-
229
-
230
-
231
-
232
-
233
-
234
-
235
-
236
-
237
-
238
-
239
-
240
-
241
-
242
-
243
-
244
-
245
-
246
-
247
-
248
-
249
-
250
-
251
-
252
-
253
-
254
-
255
-
256
-
257
-
258
-
259
-
260
-
261
-
262
-
263
-
264
-
265
-
266
-
267
-
268
-
269
-
270
-
271
-
272
-
273
-
274
-
275
-
276
-
277
-
278
-
279
-
280
-
281
-
282
-
283
-
284
-
285
-
286
-
287
-
288
-
289
-
290
-
291
-
292
-
293
-
294
-
295
-
296
-
297
-
298
-
299
-
300
-
301
-
302
-
303
-
304
-
305
-
306
-
307
-
308
-
309
-
310
-
311
-
312
-
313
-
314
-
315
-
316
-
317
-
318
-
319
-
320
-
321
-
322
-
323
-
324
-
325
-
326
-
327
-
328
-
329
-
330
-
331
-
332
 |
 |

10
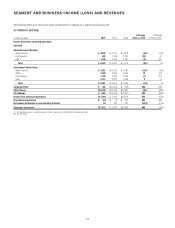
RESULTS OF OPERATIONS
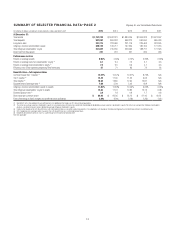
SUMMARY OF SELECTED FINANCIAL DATA—PAGE 1
In millions of dollars, except per-share amounts and ratios 2015 2014 2013 2012 2011
Net interest revenue $46,630 $47,993 $46,793 $46,686 $47,649
Non-interest revenue 29,724 29,226 29,931 22,844 29,986
Revenues, net of interest expense $76,354 $77,219 $76,724 $69,530 $77,635
Operating expenses 43,615 55,051 48,408 50,036 50,180
Provisions for credit losses and for benefits and claims 7,913 7,467 8,514 11,329 12,359
Income from continuing operations before income taxes $24,826 $14,701 $19,802 $ 8,165 $15,096
Income taxes 7,440 7,197 6,186 397 4,020
Income from continuing operations $17,386 $ 7,504 $13,616 $ 7,768 $11,076
Income (loss) from discontinued operations, net of taxes (1) (54) (2) 270 (58) 68
Net income before attribution of noncontrolling interests $17,332 $ 7,502 $13,886 $ 7,710 $11,144
Net income attributable to noncontrolling interests 90 192 227 219 148
Citigroup’s net income $17,242 $ 7,310 $13,659 $ 7,491 $10,996
Less:
Preferred dividends—Basic $ 769 $ 511 $ 194 $ 26 $ 26
Dividends and undistributed earnings allocated to employee restricted
and deferred shares that contain nonforfeitable rights to dividends,
applicable to basic EPS 224 111 263 164 184
Income allocated to unrestricted common shareholders for basic EPS $16,249 $ 6,688 $13,202 $ 7,301 $10,786
Add: Other adjustments to income —1 1 10 16
Income allocated to unrestricted common shareholders for diluted EPS $16,249 $ 6,689 $13,203 $ 7,311 $10,802
Earnings per share
Basic
Income from continuing operations $ 5.43 $ 2.21 $ 4.26 $ 2.51 $ 3.68
Net income 5.41 2.21 4.35 2.49 3.71
Diluted
Income from continuing operations $ 5.42 $ 2.20 $ 4.25 $ 2.44 $ 3.58
Net income 5.40 2.20 4.34 2.42 3.60
Dividends declared per common share 0.16 0.04 0.04 0.04 0.03
Statement continues on the next page, including notes to the table.
Citigroup Inc. and Consolidated Subsidiaries