Citibank 2015 Annual Report Download - page 50
Download and view the complete annual report
Please find page 50 of the 2015 Citibank annual report below. You can navigate through the pages in the report by either clicking on the pages listed below, or by using the keyword search tool below to find specific information within the annual report.-
 1
1 -
2
-
3
-
4
-
5
-
6
-
7
-
8
-
9
-
10
-
11
-
12
-
13
-
14
-
15
-
16
-
17
-
18
-
19
-
20
-
21
-
22
-
23
-
24
-
25
-
26
-
27
-
28
-
29
-
30
-
31
-
32
-
33
-
34
-
35
-
36
-
37
-
38
-
39
-
 40
40 -
 41
41 -
 42
42 -
 43
43 -
 44
44 -
 45
45 -
 46
46 -
 47
47 -
 48
48 -
 49
49 -
 50
50 -
 51
51 -
 52
52 -
 53
53 -
 54
54 -
 55
55 -
 56
56 -
 57
57 -
 58
58 -
 59
59 -
 60
60 -
61
-
62
-
63
-
64
-
65
-
66
-
67
-
68
-
69
-
70
-
71
-
72
-
73
-
74
-
75
-
76
-
77
-
78
-
79
-
80
-
81
-
82
-
83
-
84
-
85
-
86
-
87
-
88
-
89
-
90
-
91
-
92
-
93
-
94
-
95
-
96
-
97
-
98
-
99
-
100
-
101
-
102
-
103
-
104
-
105
-
106
-
107
-
108
-
109
-
110
-
111
-
112
-
113
-
114
-
115
-
116
-
117
-
118
-
119
-
120
-
121
-
122
-
123
-
124
-
125
-
126
-
127
-
128
-
129
-
130
-
131
-
132
-
133
-
134
-
135
-
136
-
137
-
138
-
139
-
140
-
141
-
142
-
143
-
144
-
145
-
146
-
147
-
148
-
149
-
150
-
151
-
152
-
153
-
154
-
155
-
156
-
157
-
158
-
159
-
160
-
161
-
162
-
163
-
164
-
165
-
166
-
167
-
168
-
169
-
170
-
171
-
172
-
173
-
174
-
175
-
176
-
177
-
178
-
179
-
180
-
181
-
182
-
183
-
184
-
185
-
186
-
187
-
188
-
189
-
190
-
191
-
192
-
193
-
194
-
195
-
196
-
197
-
198
-
199
-
200
-
201
-
202
-
203
-
204
-
205
-
206
-
207
-
208
-
209
-
210
-
211
-
212
-
213
-
214
-
215
-
216
-
217
-
218
-
219
-
220
-
221
-
222
-
223
-
224
-
225
-
226
-
227
-
228
-
229
-
230
-
231
-
232
-
233
-
234
-
235
-
236
-
237
-
238
-
239
-
240
-
241
-
242
-
243
-
244
-
245
-
246
-
247
-
248
-
249
-
250
-
251
-
252
-
253
-
254
-
255
-
256
-
257
-
258
-
259
-
260
-
261
-
262
-
263
-
264
-
265
-
266
-
267
-
268
-
269
-
270
-
271
-
272
-
273
-
274
-
275
-
276
-
277
-
278
-
279
-
280
-
281
-
282
-
283
-
284
-
285
-
286
-
287
-
288
-
289
-
290
-
291
-
292
-
293
-
294
-
295
-
296
-
297
-
298
-
299
-
300
-
301
-
302
-
303
-
304
-
305
-
306
-
307
-
308
-
309
-
310
-
311
-
312
-
313
-
314
-
315
-
316
-
317
-
318
-
319
-
320
-
321
-
322
-
323
-
324
-
325
-
326
-
327
-
328
-
329
-
330
-
331
-
332
 |
 |

32
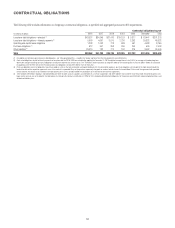
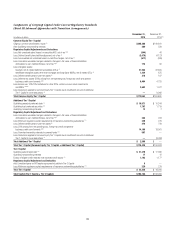
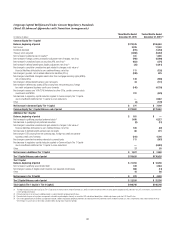
CONTRACTUAL OBLIGATIONS
The following table includes information on Citigroup’s contractual obligations, as specified and aggregated pursuant to SEC requirements.
Contractual obligations by year
In millions of dollars 2016 2017 2018 2019 2020 Thereafter Total
Long-term debt obligations—principal (1) $43,537 $34,345 $31,416 $19,153 $ 9,377 $ 63,447 $201,275
Long-term debt obligations—interest payments (2) 5,960 4,667 3,575 2,736 2,262 29,332 48,532
Operating and capital lease obligations 1,238 1,002 778 698 567 4,483 8,766
Purchase obligations (3) 612 547 258 246 240 500 2,403
Other liabilities (4) 29,015 732 772 192 276 3,462 34,449
Total $80,362 $41,293 $36,799 $23,025 $12,722 $101,224 $295,425
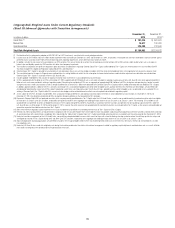
(1) For additional information about long-term debt obligations, see “Managing Global Risk—Liquidity Risk” below and Note 18 to the Consolidated Financial Statements.
(2) Contractual obligations related to interest payments on long-term debt for 2016–2020 are calculated by applying the December 31, 2015 weighted-average interest rate (3.32%) on average outstanding long-term
debt to the average remaining contractual obligations on long-term debt for each of those years. The “Thereafter” interest payments on long-term debt for the remaining years to maturity (2021–2098) are calculated
by applying current interest rates on the remaining contractual obligations on long-term debt for each of those years.
(3) Purchase obligations consist of obligations to purchase goods or services that are enforceable and legally binding on Citi. For presentation purposes, purchase obligations are included in the table above through the
termination date of the respective agreements, even if the contract is renewable. Many of the purchase agreements for goods or services include clauses that would allow Citi to cancel the agreement with specified
notice; however, that impact is not included in the table above (unless Citi has already notified the counterparty of its intention to terminate the agreement).
(4) Other liabilities reflected on Citigroup’s Consolidated Balance Sheet includes accounts payable, accrued expenses, uncertain tax positions and other liabilities that have been incurred and will ultimately be paid in cash;
legal reserve accruals are not included in the table above. Also includes discretionary contributions in 2016 for Citi’s employee-defined benefit obligations for the pension, postretirement and postemployment plans and
defined contribution plans.