Citibank 2015 Annual Report Download - page 34
Download and view the complete annual report
Please find page 34 of the 2015 Citibank annual report below. You can navigate through the pages in the report by either clicking on the pages listed below, or by using the keyword search tool below to find specific information within the annual report.-
 1
1 -
2
-
3
-
4
-
5
-
6
-
7
-
8
-
9
-
10
-
11
-
12
-
13
-
14
-
15
-
16
-
17
-
18
-
19
-
20
-
21
-
22
-
23
-
 24
24 -
 25
25 -
 26
26 -
 27
27 -
 28
28 -
 29
29 -
 30
30 -
 31
31 -
 32
32 -
 33
33 -
 34
34 -
 35
35 -
 36
36 -
 37
37 -
 38
38 -
 39
39 -
 40
40 -
 41
41 -
 42
42 -
 43
43 -
 44
44 -
45
-
46
-
47
-
48
-
49
-
50
-
51
-
52
-
53
-
54
-
55
-
56
-
57
-
58
-
59
-
60
-
61
-
62
-
63
-
64
-
65
-
66
-
67
-
68
-
69
-
70
-
71
-
72
-
73
-
74
-
75
-
76
-
77
-
78
-
79
-
80
-
81
-
82
-
83
-
84
-
85
-
86
-
87
-
88
-
89
-
90
-
91
-
92
-
93
-
94
-
95
-
96
-
97
-
98
-
99
-
100
-
101
-
102
-
103
-
104
-
105
-
106
-
107
-
108
-
109
-
110
-
111
-
112
-
113
-
114
-
115
-
116
-
117
-
118
-
119
-
120
-
121
-
122
-
123
-
124
-
125
-
126
-
127
-
128
-
129
-
130
-
131
-
132
-
133
-
134
-
135
-
136
-
137
-
138
-
139
-
140
-
141
-
142
-
143
-
144
-
145
-
146
-
147
-
148
-
149
-
150
-
151
-
152
-
153
-
154
-
155
-
156
-
157
-
158
-
159
-
160
-
161
-
162
-
163
-
164
-
165
-
166
-
167
-
168
-
169
-
170
-
171
-
172
-
173
-
174
-
175
-
176
-
177
-
178
-
179
-
180
-
181
-
182
-
183
-
184
-
185
-
186
-
187
-
188
-
189
-
190
-
191
-
192
-
193
-
194
-
195
-
196
-
197
-
198
-
199
-
200
-
201
-
202
-
203
-
204
-
205
-
206
-
207
-
208
-
209
-
210
-
211
-
212
-
213
-
214
-
215
-
216
-
217
-
218
-
219
-
220
-
221
-
222
-
223
-
224
-
225
-
226
-
227
-
228
-
229
-
230
-
231
-
232
-
233
-
234
-
235
-
236
-
237
-
238
-
239
-
240
-
241
-
242
-
243
-
244
-
245
-
246
-
247
-
248
-
249
-
250
-
251
-
252
-
253
-
254
-
255
-
256
-
257
-
258
-
259
-
260
-
261
-
262
-
263
-
264
-
265
-
266
-
267
-
268
-
269
-
270
-
271
-
272
-
273
-
274
-
275
-
276
-
277
-
278
-
279
-
280
-
281
-
282
-
283
-
284
-
285
-
286
-
287
-
288
-
289
-
290
-
291
-
292
-
293
-
294
-
295
-
296
-
297
-
298
-
299
-
300
-
301
-
302
-
303
-
304
-
305
-
306
-
307
-
308
-
309
-
310
-
311
-
312
-
313
-
314
-
315
-
316
-
317
-
318
-
319
-
320
-
321
-
322
-
323
-
324
-
325
-
326
-
327
-
328
-
329
-
330
-
331
-
332
 |
 |

16
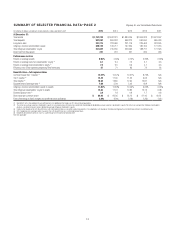
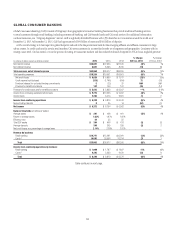
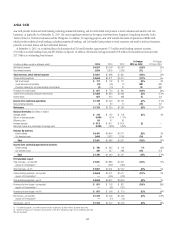
GLOBAL CONSUMER BANKING
Global Consumer Banking (GCB) consists of Citigroup’s four geographical consumer banking businesses that provide traditional banking services
to retail customers through retail banking, including commercial banking, and Citi-branded cards and Citi retail services (for additional information
on these businesses, see “Citigroup Segments” above). GCB is a globally diversified business with 2,994 branches in 24 countries around the world as of
December 31, 2015. At December 31, 2015, GCB had approximately $394 billion of assets and $301 billion of deposits.
GCB’s overall strategy is to leverage Citi’s global footprint and seek to be the preeminent bank for the emerging affluent and affluent consumers in large
urban centers. In credit cards and in certain retail markets, Citi serves customers in a somewhat broader set of segments and geographies. Consistent with its
strategy, since 2012, Citi has exited, or is in the process of exiting, 20 consumer markets and has reduced its branch footprint by 25% to focus its global presence.
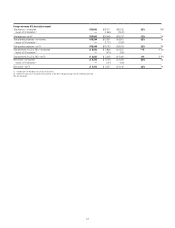
In millions of dollars except as otherwise noted 2015 2014 2013
% Change
2015 vs. 2014
% Change
2014 vs. 2013
Net interest revenue $26,881 $27,924 $27,545 (4)% 1%
Non-interest revenue 6,981 8,093 8,760 (14) (8)
Total revenues, net of interest expense $33,862 $36,017 $36,305 (6)% (1)%
Total operating expenses $18,264 $19,951 $19,801 (8)% 1%
Net credit losses $ 6,029 $ 6,860 $ 7,017 (12)% (2)%
Credit reserve build (release) (318) (1,148) (654) 72 (76)
Provision (release) for unfunded lending commitments 5(23) 37 NM NM
Provision for benefits and claims 107 144 167 (26) (14)
Provisions for credit losses and for benefits and claims $ 5,823 $ 5,833 $ 6,567 —% (11)%
Income from continuing operations before taxes $ 9,775 $10,233 $ 9,937 (4)% 3%
Income taxes 3,393 3,414 3,361 (1) 2
Income from continuing operations $ 6,382 $ 6,819 $ 6,576 (6)% 4%
Noncontrolling interests 925 14 (64) 79
Net income $ 6,373 $ 6,794 $ 6,562 (6)% 4%
Balance Sheet data (in billions of dollars)
Average assets $ 391 $ 408 $ 401 (4)% 2%
Return on average assets 1.63% 1.67% 1.65%
Efficiency ratio 54 55 55
Total EOP assets $ 394 $ 406 $ 413 (3) (2)
Average deposits 300 305 299 (2) 2
Net credit losses as a percentage of average loans 2.14% 2.36% 2.52%
Revenue by business
Retail banking $14,777 $15,461 $15,991 (4)% (3)%
Cards (1) 19,085 20,556 20,314 (7) 1
Total $33,862 $36,017 $36,305 (6)% (1)%
Income from continuing operations by business
Retail banking $ 1,989 $ 1,787 $ 1,897 11% (6)%
Cards (1) 4,393 5,032 4,679 (13) 8
Total $ 6,382 $ 6,819 $ 6,576 (6)% 4%
Table continues on next page.