Citibank 2015 Annual Report Download - page 292
Download and view the complete annual report
Please find page 292 of the 2015 Citibank annual report below. You can navigate through the pages in the report by either clicking on the pages listed below, or by using the keyword search tool below to find specific information within the annual report.-
 1
1 -
2
-
3
-
4
-
5
-
6
-
7
-
8
-
9
-
10
-
11
-
12
-
13
-
14
-
15
-
16
-
17
-
18
-
19
-
20
-
21
-
22
-
23
-
24
-
25
-
26
-
27
-
28
-
29
-
30
-
31
-
32
-
33
-
34
-
35
-
36
-
37
-
38
-
39
-
40
-
41
-
42
-
43
-
44
-
45
-
46
-
47
-
48
-
49
-
50
-
51
-
52
-
53
-
54
-
55
-
56
-
57
-
58
-
59
-
60
-
61
-
62
-
63
-
64
-
65
-
66
-
67
-
68
-
69
-
70
-
71
-
72
-
73
-
74
-
75
-
76
-
77
-
78
-
79
-
80
-
81
-
82
-
83
-
84
-
85
-
86
-
87
-
88
-
89
-
90
-
91
-
92
-
93
-
94
-
95
-
96
-
97
-
98
-
99
-
100
-
101
-
102
-
103
-
104
-
105
-
106
-
107
-
108
-
109
-
110
-
111
-
112
-
113
-
114
-
115
-
116
-
117
-
118
-
119
-
120
-
121
-
122
-
123
-
124
-
125
-
126
-
127
-
128
-
129
-
130
-
131
-
132
-
133
-
134
-
135
-
136
-
137
-
138
-
139
-
140
-
141
-
142
-
143
-
144
-
145
-
146
-
147
-
148
-
149
-
150
-
151
-
152
-
153
-
154
-
155
-
156
-
157
-
158
-
159
-
160
-
161
-
162
-
163
-
164
-
165
-
166
-
167
-
168
-
169
-
170
-
171
-
172
-
173
-
174
-
175
-
176
-
177
-
178
-
179
-
180
-
181
-
182
-
183
-
184
-
185
-
186
-
187
-
188
-
189
-
190
-
191
-
192
-
193
-
194
-
195
-
196
-
197
-
198
-
199
-
200
-
201
-
202
-
203
-
204
-
205
-
206
-
207
-
208
-
209
-
210
-
211
-
212
-
213
-
214
-
215
-
216
-
217
-
218
-
219
-
220
-
221
-
222
-
223
-
224
-
225
-
226
-
227
-
228
-
229
-
230
-
231
-
232
-
233
-
234
-
235
-
236
-
237
-
238
-
239
-
240
-
241
-
242
-
243
-
244
-
245
-
246
-
247
-
248
-
249
-
250
-
251
-
252
-
253
-
254
-
255
-
256
-
257
-
258
-
259
-
260
-
261
-
262
-
263
-
264
-
265
-
266
-
267
-
268
-
269
-
270
-
271
-
272
-
273
-
274
-
275
-
276
-
277
-
278
-
279
-
280
-
281
-
 282
282 -
 283
283 -
 284
284 -
 285
285 -
 286
286 -
 287
287 -
 288
288 -
 289
289 -
 290
290 -
 291
291 -
 292
292 -
 293
293 -
 294
294 -
 295
295 -
 296
296 -
 297
297 -
 298
298 -
 299
299 -
 300
300 -
 301
301 -
 302
302 -
303
-
304
-
305
-
306
-
307
-
308
-
309
-
310
-
311
-
312
-
313
-
314
-
315
-
316
-
317
-
318
-
319
-
320
-
321
-
322
-
323
-
324
-
325
-
326
-
327
-
328
-
329
-
330
-
331
-
332
 |
 |

274
Certain Investments in Unallocated Precious Metals
Citigroup invests in unallocated precious metals accounts (gold, silver,
platinum and palladium) as part of its commodity and foreign currency
trading activities or to economically hedge certain exposures from issuing
structured liabilities. Under ASC 815, the investment is bifurcated into a debt
host contract and a commodity forward derivative instrument. Citigroup
elects the fair value option for the debt host contract, and reports the debt
host contract within Trading account assets on the Company’s Consolidated
Balance Sheet. The total carrying amount of debt host contracts across
unallocated precious metals accounts was approximately $0.6 billion and
$1.2 billion at December 31, 2015 and 2014, respectively. The amounts are
expected to fluctuate based on trading activity in future periods.
As part of its commodity and foreign currency trading activities, Citi
sells (buys) unallocated precious metals investments and executes forward
purchase (sale) derivative contracts with trading counterparties. When
Citi sells an unallocated precious metals investment, Citi’s receivable from
its depository bank is repaid and Citi derecognizes its investment in the
unallocated precious metal. The forward purchase (sale) contract with the
trading counterparty indexed to unallocated precious metals is accounted
for as a derivative, at fair value through earnings. As of December 31,
2015, there were approximately $10.6 billion and $9.2 billion notional
amounts of such forward purchase and forward sale derivative contracts
outstanding, respectively.
Certain Investments in Private Equity and Real Estate
Ventures and Certain Equity Method and Other Investments
Citigroup invests in private equity and real estate ventures for the purpose
of earning investment returns and for capital appreciation. The Company
has elected the fair value option for certain of these ventures, because such
investments are considered similar to many private equity or hedge fund
activities in Citi’s investment companies, which are reported at fair value.
The fair value option brings consistency in the accounting and evaluation of
these investments. All investments (debt and equity) in such private equity
and real estate entities are accounted for at fair value. These investments are
classified as Investments on Citigroup’s Consolidated Balance Sheet.
Changes in the fair values of these investments are classified in Other
revenue in the Company’s Consolidated Statement of Income.
Citigroup also elects the fair value option for certain non-marketable
equity securities whose risk is managed with derivative instruments that are
accounted for at fair value through earnings. These securities are classified as
Trading account assets on Citigroup’s Consolidated Balance Sheet. Changes
in the fair value of these securities and the related derivative instruments are
recorded in Principal transactions.
Certain Mortgage Loans HFS
Citigroup has elected the fair value option for certain purchased and
originated prime fixed-rate and conforming adjustable-rate first mortgage
loans HFS. These loans are intended for sale or securitization and are hedged
with derivative instruments. The Company has elected the fair value option
to mitigate accounting mismatches in cases where hedge accounting is
complex and to achieve operational simplifications.
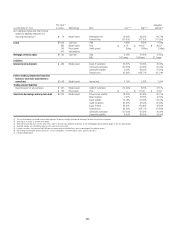
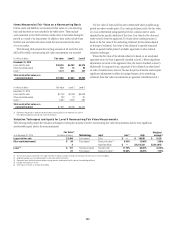
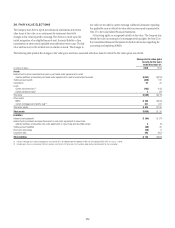
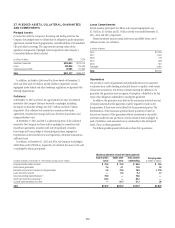
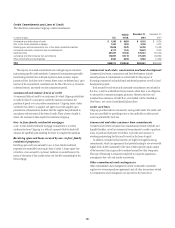
The following table provides information about certain mortgage loans HFS carried at fair value:
In millions of dollars December 31, 2015 December 31, 2014
Carrying amount reported on the Consolidated Balance Sheet $745 $1,447
Aggregate fair value in excess of unpaid principal balance 20 67
Balance of non-accrual loans or loans more than 90 days past due ——
Aggregate unpaid principal balance in excess of fair value for non-accrual loans or loans more than 90 days past due ——
The changes in the fair values of these mortgage loans are reported in
Other revenue in the Company’s Consolidated Statement of Income. There
was no net change in fair value during the years ended December 31, 2015
and 2014 due to instrument-specific credit risk. Related interest income
continues to be measured based on the contractual interest rates and reported
as Interest revenue in the Consolidated Statement of Income.