Citibank 2015 Annual Report Download - page 208
Download and view the complete annual report
Please find page 208 of the 2015 Citibank annual report below. You can navigate through the pages in the report by either clicking on the pages listed below, or by using the keyword search tool below to find specific information within the annual report.-
 1
1 -
2
-
3
-
4
-
5
-
6
-
7
-
8
-
9
-
10
-
11
-
12
-
13
-
14
-
15
-
16
-
17
-
18
-
19
-
20
-
21
-
22
-
23
-
24
-
25
-
26
-
27
-
28
-
29
-
30
-
31
-
32
-
33
-
34
-
35
-
36
-
37
-
38
-
39
-
40
-
41
-
42
-
43
-
44
-
45
-
46
-
47
-
48
-
49
-
50
-
51
-
52
-
53
-
54
-
55
-
56
-
57
-
58
-
59
-
60
-
61
-
62
-
63
-
64
-
65
-
66
-
67
-
68
-
69
-
70
-
71
-
72
-
73
-
74
-
75
-
76
-
77
-
78
-
79
-
80
-
81
-
82
-
83
-
84
-
85
-
86
-
87
-
88
-
89
-
90
-
91
-
92
-
93
-
94
-
95
-
96
-
97
-
98
-
99
-
100
-
101
-
102
-
103
-
104
-
105
-
106
-
107
-
108
-
109
-
110
-
111
-
112
-
113
-
114
-
115
-
116
-
117
-
118
-
119
-
120
-
121
-
122
-
123
-
124
-
125
-
126
-
127
-
128
-
129
-
130
-
131
-
132
-
133
-
134
-
135
-
136
-
137
-
138
-
139
-
140
-
141
-
142
-
143
-
144
-
145
-
146
-
147
-
148
-
149
-
150
-
151
-
152
-
153
-
154
-
155
-
156
-
157
-
158
-
159
-
160
-
161
-
162
-
163
-
164
-
165
-
166
-
167
-
168
-
169
-
170
-
171
-
172
-
173
-
174
-
175
-
176
-
177
-
178
-
179
-
180
-
181
-
182
-
183
-
184
-
185
-
186
-
187
-
188
-
189
-
190
-
191
-
192
-
193
-
194
-
195
-
196
-
197
-
 198
198 -
 199
199 -
 200
200 -
 201
201 -
 202
202 -
 203
203 -
 204
204 -
 205
205 -
 206
206 -
 207
207 -
 208
208 -
 209
209 -
 210
210 -
 211
211 -
 212
212 -
 213
213 -
 214
214 -
 215
215 -
 216
216 -
 217
217 -
 218
218 -
219
-
220
-
221
-
222
-
223
-
224
-
225
-
226
-
227
-
228
-
229
-
230
-
231
-
232
-
233
-
234
-
235
-
236
-
237
-
238
-
239
-
240
-
241
-
242
-
243
-
244
-
245
-
246
-
247
-
248
-
249
-
250
-
251
-
252
-
253
-
254
-
255
-
256
-
257
-
258
-
259
-
260
-
261
-
262
-
263
-
264
-
265
-
266
-
267
-
268
-
269
-
270
-
271
-
272
-
273
-
274
-
275
-
276
-
277
-
278
-
279
-
280
-
281
-
282
-
283
-
284
-
285
-
286
-
287
-
288
-
289
-
290
-
291
-
292
-
293
-
294
-
295
-
296
-
297
-
298
-
299
-
300
-
301
-
302
-
303
-
304
-
305
-
306
-
307
-
308
-
309
-
310
-
311
-
312
-
313
-
314
-
315
-
316
-
317
-
318
-
319
-
320
-
321
-
322
-
323
-
324
-
325
-
326
-
327
-
328
-
329
-
330
-
331
-
332
 |
 |

190
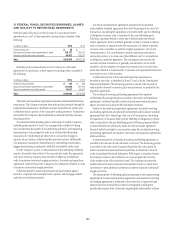
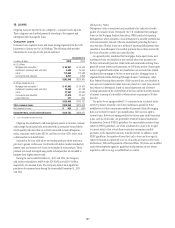
The Company has the positive intent and ability to hold these securities to
maturity or, where applicable, the exercise of any issuer call options, absent
any unforeseen significant changes in circumstances, including deterioration
in credit or changes in regulatory capital requirements.
The net unrealized losses classified in AOCI primarily relate to debt
securities previously classified as AFS that have been transferred to HTM, and
include any cumulative fair value hedge adjustments. The net unrealized
loss amount also includes any non-credit-related changes in fair value of
HTM securities that have suffered credit impairment recorded in earnings.
The AOCI balance related to HTM securities is amortized over the remaining
contractual life of the related securities as an adjustment of yield in a
manner consistent with the accretion of any difference between the carrying
value at the transfer date and par value of the same debt securities.
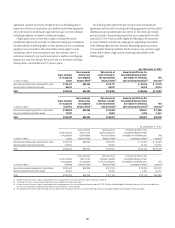
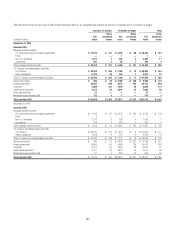
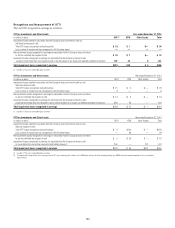
The table below shows the fair value of debt securities HTM that have been in an unrecognized loss position for less than 12 months and for 12 months
or longer:
Less than 12 months 12 months or longer Total
In millions of dollars
Fair
value
Gross
unrecognized
losses
Fair
value
Gross
unrecognized
losses
Fair
value
Gross
unrecognized
losses
December 31, 2015
Debt securities held-to-maturity
Mortgage-backed securities $ 935 $ 1 $10,301 $262 $11,236 $263
State and municipal 881 20 1,826 67 2,707 87
Foreign government 180 3 — — 180 3
Asset-backed securities 132 13 3,232 28 3,364 41
Total debt securities held-to-maturity $2,128 $ 37 $15,359 $357 $17,487 $394
December 31, 2014
Debt securities held-to-maturity
Mortgage-backed securities $ 4 $— $ 1,134 $294 $ 1,138 $294
State and municipal 2,528 34 314 23 2,842 57
Foreign government — — — — — —
Asset-backed securities 9 1 174 9 183 10
Total debt securities held-to-maturity $2,541 $ 35 $ 1,622 $326 $ 4,163 $361
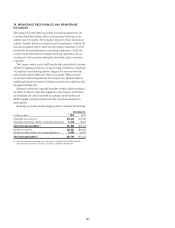
Excluded from the gross unrecognized losses presented in the above table
are $(453) million and $(780) million of net unrealized losses recorded in
AOCI as of December 31, 2015 and December 31, 2014, respectively, primarily
related to the difference between the amortized cost and carrying value of
HTM securities that were reclassified from AFS. Substantially all of these net
unrecognized losses relate to securities that have been in a loss position for
12 months or longer at December 31, 2015 and December 31, 2014.