Citibank 2015 Annual Report Download - page 214
Download and view the complete annual report
Please find page 214 of the 2015 Citibank annual report below. You can navigate through the pages in the report by either clicking on the pages listed below, or by using the keyword search tool below to find specific information within the annual report.-
 1
1 -
2
-
3
-
4
-
5
-
6
-
7
-
8
-
9
-
10
-
11
-
12
-
13
-
14
-
15
-
16
-
17
-
18
-
19
-
20
-
21
-
22
-
23
-
24
-
25
-
26
-
27
-
28
-
29
-
30
-
31
-
32
-
33
-
34
-
35
-
36
-
37
-
38
-
39
-
40
-
41
-
42
-
43
-
44
-
45
-
46
-
47
-
48
-
49
-
50
-
51
-
52
-
53
-
54
-
55
-
56
-
57
-
58
-
59
-
60
-
61
-
62
-
63
-
64
-
65
-
66
-
67
-
68
-
69
-
70
-
71
-
72
-
73
-
74
-
75
-
76
-
77
-
78
-
79
-
80
-
81
-
82
-
83
-
84
-
85
-
86
-
87
-
88
-
89
-
90
-
91
-
92
-
93
-
94
-
95
-
96
-
97
-
98
-
99
-
100
-
101
-
102
-
103
-
104
-
105
-
106
-
107
-
108
-
109
-
110
-
111
-
112
-
113
-
114
-
115
-
116
-
117
-
118
-
119
-
120
-
121
-
122
-
123
-
124
-
125
-
126
-
127
-
128
-
129
-
130
-
131
-
132
-
133
-
134
-
135
-
136
-
137
-
138
-
139
-
140
-
141
-
142
-
143
-
144
-
145
-
146
-
147
-
148
-
149
-
150
-
151
-
152
-
153
-
154
-
155
-
156
-
157
-
158
-
159
-
160
-
161
-
162
-
163
-
164
-
165
-
166
-
167
-
168
-
169
-
170
-
171
-
172
-
173
-
174
-
175
-
176
-
177
-
178
-
179
-
180
-
181
-
182
-
183
-
184
-
185
-
186
-
187
-
188
-
189
-
190
-
191
-
192
-
193
-
194
-
195
-
196
-
197
-
198
-
199
-
200
-
201
-
202
-
203
-
 204
204 -
 205
205 -
 206
206 -
 207
207 -
 208
208 -
 209
209 -
 210
210 -
 211
211 -
 212
212 -
 213
213 -
 214
214 -
 215
215 -
 216
216 -
 217
217 -
 218
218 -
 219
219 -
 220
220 -
 221
221 -
 222
222 -
 223
223 -
 224
224 -
225
-
226
-
227
-
228
-
229
-
230
-
231
-
232
-
233
-
234
-
235
-
236
-
237
-
238
-
239
-
240
-
241
-
242
-
243
-
244
-
245
-
246
-
247
-
248
-
249
-
250
-
251
-
252
-
253
-
254
-
255
-
256
-
257
-
258
-
259
-
260
-
261
-
262
-
263
-
264
-
265
-
266
-
267
-
268
-
269
-
270
-
271
-
272
-
273
-
274
-
275
-
276
-
277
-
278
-
279
-
280
-
281
-
282
-
283
-
284
-
285
-
286
-
287
-
288
-
289
-
290
-
291
-
292
-
293
-
294
-
295
-
296
-
297
-
298
-
299
-
300
-
301
-
302
-
303
-
304
-
305
-
306
-
307
-
308
-
309
-
310
-
311
-
312
-
313
-
314
-
315
-
316
-
317
-
318
-
319
-
320
-
321
-
322
-
323
-
324
-
325
-
326
-
327
-
328
-
329
-
330
-
331
-
332
 |
 |

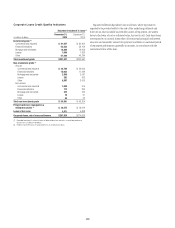
196
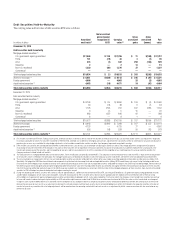
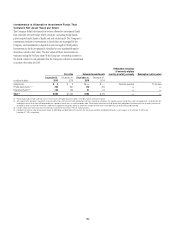
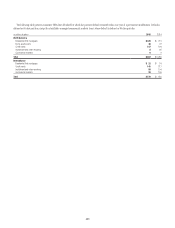
Investments in Alternative Investment Funds That
Calculate Net Asset Value per Share
The Company holds investments in certain alternative investment funds
that calculate net asset value (NAV) per share, including hedge funds,
private equity funds, funds of funds and real estate funds. The Company’s
investments include co-investments in funds that are managed by the
Company and investments in funds that are managed by third parties.
Investments in funds are generally classified as non-marketable equity
securities carried at fair value. The fair values of these investments are
estimated using the NAV per share of the Company’s ownership interest in
the funds, where it is not probable that the Company will sell an investment
at a price other than the NAV.
Fair value Unfunded commitments
Redemption frequency
(if currently eligible)
monthly, quarterly, annually Redemption notice period
In millions of dollars
December 31,
2015
December 31,
2014
December 31,
2015
December 31,
2014
Hedge funds $ 3 $ 8 $ — $ — Generally quarterly 10-95 days
Private equity funds (1)(2) 762 891 173 205 — —
Real estate funds (2)(3) 130 166 21 24 — —
Total (4) $ 895 $ 1,065 $194 $ 229 — —
(1) Private equity funds include funds that invest in infrastructure, leveraged buyout transactions, emerging markets and venture capital.
(2) With respect to the Company’s investments in private equity funds and real estate funds, distributions from each fund will be received as the underlying assets held by these funds are liquidated. It is estimated that the
underlying assets of these funds will be liquidated over a period of several years as market conditions allow. Private equity and real estate funds do not allow redemption of investments by their investors. Investors are
permitted to sell or transfer their investments, subject to the approval of the general partner or investment manager of these funds, which generally may not be unreasonably withheld.
(3) Includes several real estate funds that invest primarily in commercial real estate in the U.S., Europe and Asia.
(4) Included in the total fair value of investments above are $0.9 billion and $0.8 billion of fund assets that are valued using NAVs provided by third-party asset managers as of December 31, 2015 and
December 31, 2014, respectively.