Citibank 2015 Annual Report Download - page 55
Download and view the complete annual report
Please find page 55 of the 2015 Citibank annual report below. You can navigate through the pages in the report by either clicking on the pages listed below, or by using the keyword search tool below to find specific information within the annual report.-
 1
1 -
2
-
3
-
4
-
5
-
6
-
7
-
8
-
9
-
10
-
11
-
12
-
13
-
14
-
15
-
16
-
17
-
18
-
19
-
20
-
21
-
22
-
23
-
24
-
25
-
26
-
27
-
28
-
29
-
30
-
31
-
32
-
33
-
34
-
35
-
36
-
37
-
38
-
39
-
40
-
41
-
42
-
43
-
44
-
 45
45 -
 46
46 -
 47
47 -
 48
48 -
 49
49 -
 50
50 -
 51
51 -
 52
52 -
 53
53 -
 54
54 -
 55
55 -
 56
56 -
 57
57 -
 58
58 -
 59
59 -
 60
60 -
 61
61 -
 62
62 -
 63
63 -
 64
64 -
 65
65 -
66
-
67
-
68
-
69
-
70
-
71
-
72
-
73
-
74
-
75
-
76
-
77
-
78
-
79
-
80
-
81
-
82
-
83
-
84
-
85
-
86
-
87
-
88
-
89
-
90
-
91
-
92
-
93
-
94
-
95
-
96
-
97
-
98
-
99
-
100
-
101
-
102
-
103
-
104
-
105
-
106
-
107
-
108
-
109
-
110
-
111
-
112
-
113
-
114
-
115
-
116
-
117
-
118
-
119
-
120
-
121
-
122
-
123
-
124
-
125
-
126
-
127
-
128
-
129
-
130
-
131
-
132
-
133
-
134
-
135
-
136
-
137
-
138
-
139
-
140
-
141
-
142
-
143
-
144
-
145
-
146
-
147
-
148
-
149
-
150
-
151
-
152
-
153
-
154
-
155
-
156
-
157
-
158
-
159
-
160
-
161
-
162
-
163
-
164
-
165
-
166
-
167
-
168
-
169
-
170
-
171
-
172
-
173
-
174
-
175
-
176
-
177
-
178
-
179
-
180
-
181
-
182
-
183
-
184
-
185
-
186
-
187
-
188
-
189
-
190
-
191
-
192
-
193
-
194
-
195
-
196
-
197
-
198
-
199
-
200
-
201
-
202
-
203
-
204
-
205
-
206
-
207
-
208
-
209
-
210
-
211
-
212
-
213
-
214
-
215
-
216
-
217
-
218
-
219
-
220
-
221
-
222
-
223
-
224
-
225
-
226
-
227
-
228
-
229
-
230
-
231
-
232
-
233
-
234
-
235
-
236
-
237
-
238
-
239
-
240
-
241
-
242
-
243
-
244
-
245
-
246
-
247
-
248
-
249
-
250
-
251
-
252
-
253
-
254
-
255
-
256
-
257
-
258
-
259
-
260
-
261
-
262
-
263
-
264
-
265
-
266
-
267
-
268
-
269
-
270
-
271
-
272
-
273
-
274
-
275
-
276
-
277
-
278
-
279
-
280
-
281
-
282
-
283
-
284
-
285
-
286
-
287
-
288
-
289
-
290
-
291
-
292
-
293
-
294
-
295
-
296
-
297
-
298
-
299
-
300
-
301
-
302
-
303
-
304
-
305
-
306
-
307
-
308
-
309
-
310
-
311
-
312
-
313
-
314
-
315
-
316
-
317
-
318
-
319
-
320
-
321
-
322
-
323
-
324
-
325
-
326
-
327
-
328
-
329
-
330
-
331
-
332
 |
 |

37
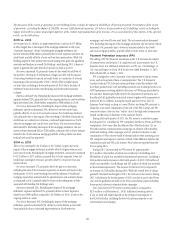
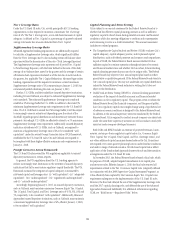
Citigroup’s Capital Resources Under Current
Regulatory Standards
During 2015 and thereafter, Citi is required to maintain stated minimum
Common Equity Tier 1 Capital, Tier 1 Capital and Total Capital ratios of
4.5%, 6% and 8%, respectively. The stated minimum Common Equity Tier 1
Capital and Tier 1 Capital ratio requirements in 2014 were 4% and 5.5%,
respectively, while the stated minimum Total Capital ratio requirement of 8%
remained unchanged.
Furthermore, to be “well capitalized” under current federal bank
regulatory agency definitions, a bank holding company must have a Tier 1
Capital ratio of at least 6%, a Total Capital ratio of at least 10%, and not be
subject to a Federal Reserve Board directive to maintain higher capital levels.
The following tables set forth the capital tiers, total risk-weighted assets,
risk-based capital ratios, quarterly adjusted average total assets, Total
Leverage Exposure and leverage ratios under current regulatory standards
(reflecting Basel III Transition Arrangements) for Citi as of December 31,
2015 and December 31, 2014.
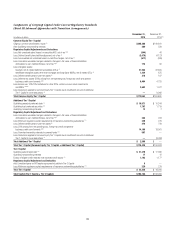
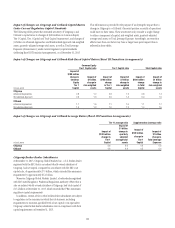
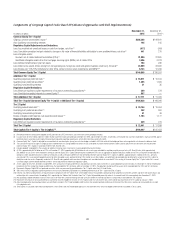
Citigroup Capital Components and Ratios Under Current Regulatory Standards (Basel III Transition Arrangements)
December 31, 2015 December 31, 2014 (1)
In millions of dollars, except ratios
Advanced
Approaches
Standardized
Approach
Advanced
Approaches
Standardized
Approach (2)
Common Equity Tier 1 Capital $ 173,862 $ 173,862 $ 166,663 $ 166,663
Tier 1 Capital 176,420 176,420 166,663 166,663
Total Capital (Tier 1 Capital + Tier 2 Capital) (3) 198,746 211,115 184,959 197,707
Total Risk-Weighted Assets 1,190,853 1,138,711 1,274,672 1,211,358
Common Equity Tier 1 Capital ratio (4) 14.60% 15.27% 13.07% 13.76%
Tier 1 Capital ratio (4) 14.81 15.49 13.07 13.76
Total Capital ratio (4) 16.69 18.54 14.51 16.32
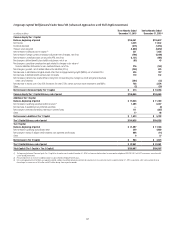
In millions of dollars, except ratios December 31, 2015 December 31, 2014 (1)
Quarterly Adjusted Average Total Assets (5) $1,732,933 $1,849,325
Total Leverage Exposure (6) 2,326,072 2,518,115
Tier 1 Leverage ratio 10.18% 9.01%
Supplementary Leverage ratio 7.58 6.62
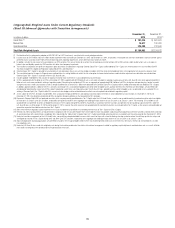
(1) Restated to reflect the retrospective adoption of ASU 2014-01 for Low Income Housing Tax Credit (LIHTC) investments, consistent with current period presentation.
(2) Pro forma presentation to reflect the application of the Basel III 2015 Standardized Approach, consistent with current period presentation.
(3) Under the Advanced Approaches framework eligible credit reserves that exceed expected credit losses are eligible for inclusion in Tier 2 Capital to the extent the excess reserves do not exceed 0.6% of credit risk-
weighted assets, which differs from the Standardized Approach in which the allowance for credit losses is eligible for inclusion in Tier 2 Capital up to 1.25% of credit risk-weighted assets, with any excess allowance for
credit losses being deducted in arriving at credit risk-weighted assets.
(4) As of December 31, 2015 and December 31, 2014, Citi’s reportable Common Equity Tier 1 Capital, Tier 1 Capital, and Total Capital ratios were the lower derived under the Basel III Advanced Approaches framework.
(5) Tier 1 Leverage ratio denominator.
(6) Supplementary Leverage ratio denominator.
As indicated in the table above, Citigroup’s capital ratios at December 31,
2015 were in excess of the stated minimum requirements under the U.S.
Basel III rules. In addition, Citi was also “well capitalized” under current
federal bank regulatory agency definitions as of December 31, 2015.