Citibank 2015 Annual Report Download - page 204
Download and view the complete annual report
Please find page 204 of the 2015 Citibank annual report below. You can navigate through the pages in the report by either clicking on the pages listed below, or by using the keyword search tool below to find specific information within the annual report.-
 1
1 -
2
-
3
-
4
-
5
-
6
-
7
-
8
-
9
-
10
-
11
-
12
-
13
-
14
-
15
-
16
-
17
-
18
-
19
-
20
-
21
-
22
-
23
-
24
-
25
-
26
-
27
-
28
-
29
-
30
-
31
-
32
-
33
-
34
-
35
-
36
-
37
-
38
-
39
-
40
-
41
-
42
-
43
-
44
-
45
-
46
-
47
-
48
-
49
-
50
-
51
-
52
-
53
-
54
-
55
-
56
-
57
-
58
-
59
-
60
-
61
-
62
-
63
-
64
-
65
-
66
-
67
-
68
-
69
-
70
-
71
-
72
-
73
-
74
-
75
-
76
-
77
-
78
-
79
-
80
-
81
-
82
-
83
-
84
-
85
-
86
-
87
-
88
-
89
-
90
-
91
-
92
-
93
-
94
-
95
-
96
-
97
-
98
-
99
-
100
-
101
-
102
-
103
-
104
-
105
-
106
-
107
-
108
-
109
-
110
-
111
-
112
-
113
-
114
-
115
-
116
-
117
-
118
-
119
-
120
-
121
-
122
-
123
-
124
-
125
-
126
-
127
-
128
-
129
-
130
-
131
-
132
-
133
-
134
-
135
-
136
-
137
-
138
-
139
-
140
-
141
-
142
-
143
-
144
-
145
-
146
-
147
-
148
-
149
-
150
-
151
-
152
-
153
-
154
-
155
-
156
-
157
-
158
-
159
-
160
-
161
-
162
-
163
-
164
-
165
-
166
-
167
-
168
-
169
-
170
-
171
-
172
-
173
-
174
-
175
-
176
-
177
-
178
-
179
-
180
-
181
-
182
-
183
-
184
-
185
-
186
-
187
-
188
-
189
-
190
-
191
-
192
-
193
-
 194
194 -
 195
195 -
 196
196 -
 197
197 -
 198
198 -
 199
199 -
 200
200 -
 201
201 -
 202
202 -
 203
203 -
 204
204 -
 205
205 -
 206
206 -
 207
207 -
 208
208 -
 209
209 -
 210
210 -
 211
211 -
 212
212 -
 213
213 -
 214
214 -
215
-
216
-
217
-
218
-
219
-
220
-
221
-
222
-
223
-
224
-
225
-
226
-
227
-
228
-
229
-
230
-
231
-
232
-
233
-
234
-
235
-
236
-
237
-
238
-
239
-
240
-
241
-
242
-
243
-
244
-
245
-
246
-
247
-
248
-
249
-
250
-
251
-
252
-
253
-
254
-
255
-
256
-
257
-
258
-
259
-
260
-
261
-
262
-
263
-
264
-
265
-
266
-
267
-
268
-
269
-
270
-
271
-
272
-
273
-
274
-
275
-
276
-
277
-
278
-
279
-
280
-
281
-
282
-
283
-
284
-
285
-
286
-
287
-
288
-
289
-
290
-
291
-
292
-
293
-
294
-
295
-
296
-
297
-
298
-
299
-
300
-
301
-
302
-
303
-
304
-
305
-
306
-
307
-
308
-
309
-
310
-
311
-
312
-
313
-
314
-
315
-
316
-
317
-
318
-
319
-
320
-
321
-
322
-
323
-
324
-
325
-
326
-
327
-
328
-
329
-
330
-
331
-
332
 |
 |

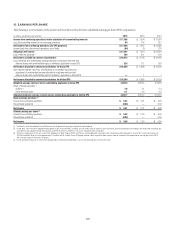
186
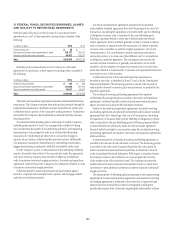
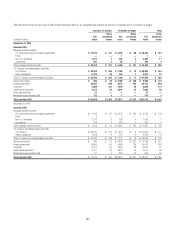
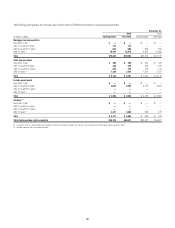
Securities Available-for-Sale
The amortized cost and fair value of AFS securities at December 31 were as follows:
2015 2014
In millions of dollars
Amortized
cost
Gross
unrealized
gains
Gross
unrealized
losses
Fair
value
Amortized
cost
Gross
unrealized
gains
Gross
unrealized
losses
Fair
value
Debt securities AFS
Mortgage-backed securities (1)
U.S. government-sponsored agency guaranteed $ 39,584 $ 367 $ 237 $ 39,714 $ 35,647 $ 603 $ 159 $ 36,091
Prime 2 — — 2 12 — — 12
Alt-A 50 5 — 55 43 1 — 44
Non-U.S. residential 5,909 31 11 5,929 8,247 67 7 8,307
Commercial 573 2 4 571 551 6 3 554
Total mortgage-backed securities $ 46,118 $ 405 $ 252 $ 46,271 $ 44,500 $ 677 $ 169 $ 45,008
U.S. Treasury and federal agency securities
U.S. Treasury $113,096 $ 254 $ 515 $112,835 $110,492 $ 353 $ 127 $110,718
Agency obligations 10,095 22 37 10,080 12,925 60 13 12,972
Total U.S. Treasury and federal agency securities $123,191 $ 276 $ 552 $122,915 $123,417 $ 413 $ 140 $123,690
State and municipal (2) $ 12,099 $ 132 $ 772 $ 11,459 $ 13,526 $ 150 $ 977 $ 12,699
Foreign government 92,384 410 593 92,201 90,249 734 286 90,697
Corporate 15,859 121 177 15,803 12,033 215 91 12,157
Asset-backed securities (1) 9,261 5 92 9,174 12,534 30 58 12,506
Other debt securities 688 — — 688 661 — — 661
Total debt securities AFS $299,600 $1,349 $ 2,438 $298,511 $296,920 $ 2,219 $1,721 $297,418
Marketable equity securities AFS $ 602 $ 26 $ 3 $ 625 $ 2,461 $ 308 $ 44 $ 2,725
Total securities AFS $300,202 $1,375 $2,441 $299,136 $299,381 $ 2,527 $1,765 $300,143
(1) The Company invests in mortgage-backed and asset-backed securities. These securitizations are generally considered VIEs. The Company’s maximum exposure to loss from these VIEs is equal to the carrying amount
of the securities, which is reflected in the table above. For mortgage-backed and asset-backed securitizations in which the Company has other involvement, see Note 22 to the Consolidated Financial Statements.
(2) The gross unrealized losses on state and municipal debt securities are primarily attributable to the effects of fair value hedge accounting. Specifically, Citi hedges the LIBOR-benchmark interest rate component
of certain fixed-rate tax-exempt state and municipal debt securities utilizing LIBOR-based interest rate swaps. During the hedge period, losses incurred on the LIBOR-hedging swaps recorded in earnings were
substantially offset by gains on the state and municipal debt securities attributable to changes in the LIBOR swap rate being hedged. However, because the LIBOR swap rate decreased significantly during the hedge
period while the overall fair value of the municipal debt securities was relatively unchanged, the effect of reclassifying fair value gains on these securities from Accumulated other comprehensive income (loss) (AOCI) to
earnings, attributable solely to changes in the LIBOR swap rate, resulted in net unrealized losses remaining in AOCI that relate to the unhedged components of these securities.
At December 31, 2015, the amortized cost of approximately 5,212
investments in equity and fixed income securities exceeded their fair
value by $2,441 million. Of the $2,441 million, the gross unrealized losses
on equity securities were $3 million. Of the remainder, $1,331 million
represented unrealized losses on fixed income investments that have been
in a gross-unrealized-loss position for less than a year and, of these, 94%
were rated investment grade; and $1,107 million represented unrealized
losses on fixed income investments that have been in a gross-unrealized-loss
position for a year or more and, of these, 90% were rated investment grade.
Of the $1,107 million mentioned above, $746 million represent state and
municipal securities.
At December 31, 2015, the AFS mortgage-backed securities portfolio
fair value balance of $46,271 million consisted of $39,714 million of
government-sponsored agency securities, and $6,557 million of privately
sponsored securities, substantially all of which were backed by non-U.S.
residential mortgages.
As discussed in more detail below, the Company conducts periodic reviews
of all securities with unrealized losses to evaluate whether the impairment is
other-than-temporary. Any credit-related impairment related to debt securities
is recorded in earnings as OTTI. Non-credit-related impairment is recognized
in AOCI if the Company does not plan to sell and is not likely to be required
to sell the security. For other debt securities with OTTI, the entire impairment
is recognized in the Consolidated Statement of Income.