Citibank 2015 Annual Report Download - page 193
Download and view the complete annual report
Please find page 193 of the 2015 Citibank annual report below. You can navigate through the pages in the report by either clicking on the pages listed below, or by using the keyword search tool below to find specific information within the annual report.-
 1
1 -
2
-
3
-
4
-
5
-
6
-
7
-
8
-
9
-
10
-
11
-
12
-
13
-
14
-
15
-
16
-
17
-
18
-
19
-
20
-
21
-
22
-
23
-
24
-
25
-
26
-
27
-
28
-
29
-
30
-
31
-
32
-
33
-
34
-
35
-
36
-
37
-
38
-
39
-
40
-
41
-
42
-
43
-
44
-
45
-
46
-
47
-
48
-
49
-
50
-
51
-
52
-
53
-
54
-
55
-
56
-
57
-
58
-
59
-
60
-
61
-
62
-
63
-
64
-
65
-
66
-
67
-
68
-
69
-
70
-
71
-
72
-
73
-
74
-
75
-
76
-
77
-
78
-
79
-
80
-
81
-
82
-
83
-
84
-
85
-
86
-
87
-
88
-
89
-
90
-
91
-
92
-
93
-
94
-
95
-
96
-
97
-
98
-
99
-
100
-
101
-
102
-
103
-
104
-
105
-
106
-
107
-
108
-
109
-
110
-
111
-
112
-
113
-
114
-
115
-
116
-
117
-
118
-
119
-
120
-
121
-
122
-
123
-
124
-
125
-
126
-
127
-
128
-
129
-
130
-
131
-
132
-
133
-
134
-
135
-
136
-
137
-
138
-
139
-
140
-
141
-
142
-
143
-
144
-
145
-
146
-
147
-
148
-
149
-
150
-
151
-
152
-
153
-
154
-
155
-
156
-
157
-
158
-
159
-
160
-
161
-
162
-
163
-
164
-
165
-
166
-
167
-
168
-
169
-
170
-
171
-
172
-
173
-
174
-
175
-
176
-
177
-
178
-
179
-
180
-
181
-
182
-
 183
183 -
 184
184 -
 185
185 -
 186
186 -
 187
187 -
 188
188 -
 189
189 -
 190
190 -
 191
191 -
 192
192 -
 193
193 -
 194
194 -
 195
195 -
 196
196 -
 197
197 -
 198
198 -
 199
199 -
 200
200 -
 201
201 -
 202
202 -
 203
203 -
204
-
205
-
206
-
207
-
208
-
209
-
210
-
211
-
212
-
213
-
214
-
215
-
216
-
217
-
218
-
219
-
220
-
221
-
222
-
223
-
224
-
225
-
226
-
227
-
228
-
229
-
230
-
231
-
232
-
233
-
234
-
235
-
236
-
237
-
238
-
239
-
240
-
241
-
242
-
243
-
244
-
245
-
246
-
247
-
248
-
249
-
250
-
251
-
252
-
253
-
254
-
255
-
256
-
257
-
258
-
259
-
260
-
261
-
262
-
263
-
264
-
265
-
266
-
267
-
268
-
269
-
270
-
271
-
272
-
273
-
274
-
275
-
276
-
277
-
278
-
279
-
280
-
281
-
282
-
283
-
284
-
285
-
286
-
287
-
288
-
289
-
290
-
291
-
292
-
293
-
294
-
295
-
296
-
297
-
298
-
299
-
300
-
301
-
302
-
303
-
304
-
305
-
306
-
307
-
308
-
309
-
310
-
311
-
312
-
313
-
314
-
315
-
316
-
317
-
318
-
319
-
320
-
321
-
322
-
323
-
324
-
325
-
326
-
327
-
328
-
329
-
330
-
331
-
332
 |
 |

175
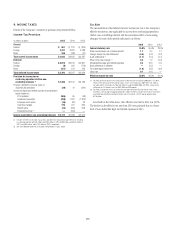
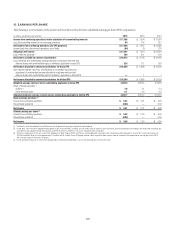
9. INCOME TAXES
Details of the Company’s income tax provision are presented below:
Income Tax Provision
In millions of dollars 2015 2014 2013
Current
Federal $ 861 $ 181 $ (260)
Foreign 3,397 3,281 3,788
State 388 388 (41)
Total current income taxes $4,646 $3,850 $ 3,487
Deferred
Federal $3,019 $2,510 $ 2,867
Foreign (4) 361 (716)
State (221) 476 548
Total deferred income taxes $2,794 $3,347 $ 2,699
Provision for income tax on
continuing operations before non-
controlling interests (1) $7,440 $7,197 $ 6,186
Provision (benefit) for income taxes on
discontinued operations (29) 12 (244)
Income tax expense (benefit) reported in stockholders’
equity related to:
FX translation (906) 65 (48)
Investment securities (498) 1,007 (1,300)
Employee stock plans (35) (87) 28
Cash flow hedges 176 207 625
Benefit plans (24) (660) 698
Retained earnings (2) —(353) —
Income taxes before non-controlling interests $ 6,124 $7,388 $ 5,945
(1) Includes the effect of securities transactions and other-than-temporary-impairment losses resulting
in a provision (benefit) of $239 million and $(93) million in 2015, $200 million and $(148) million in
2014 and $262 million and $(187) million in 2013, respectively.
(2) See “Consolidated Statement of Changes in Stockholders’ Equity” above.
Tax Rate
The reconciliation of the federal statutory income tax rate to the Company’s
effective income tax rate applicable to income from continuing operations
(before non-controlling interests and the cumulative effect of accounting
changes) for each of the periods indicated is as follows:
2015 2014 2013
Federal statutory rate 35.0% 35.0% 35.0%
State income taxes, net of federal benefit 1.7 3.4 1.7
Foreign income tax rate differential (4.6) (0.3) (2.3)
Audit settlements (1) (1.7) (2.4) (0.7)
Effect of tax law changes (2) 0.4 1.2 (0.3)
Nondeductible legal and related expenses 0.3 18.3 0.8
Basis difference in affiliates —(2.5) —
Tax advantaged investments (1.8) (3.6) (3.0)
Other, net 0.7 (0.1) —
Effective income tax rate 30.0% 49.0% 31.2%
(1) For 2015, primarily relates to the conclusion of a New York City tax audit for 2009-2011. For 2014,
relates to the conclusion of the audit of various issues in the Company’s 2009-2011 U.S. federal
tax audit and the conclusion of a New York State tax audit for 2006-2008. For 2013, relates to the
settlement of U.S. federal issues for 2003-2005 and IRS appeals.
(2) For 2015, includes the results of tax reforms enacted in New York City and several states, which
resulted in a DTA charge of approximately $101 million. For 2014, includes the results of tax reforms
enacted in New York State and South Dakota, which resulted in a DTA charge of approximately
$210 million.
As set forth in the table above, Citi’s effective tax rate for 2015 was 30.0%.
The decline in the effective tax rate from 2014 was primarily due to a lower
level of non-deductible legal and related expenses in 2015.