Citibank 2015 Annual Report Download - page 88
Download and view the complete annual report
Please find page 88 of the 2015 Citibank annual report below. You can navigate through the pages in the report by either clicking on the pages listed below, or by using the keyword search tool below to find specific information within the annual report.-
 1
1 -
2
-
3
-
4
-
5
-
6
-
7
-
8
-
9
-
10
-
11
-
12
-
13
-
14
-
15
-
16
-
17
-
18
-
19
-
20
-
21
-
22
-
23
-
24
-
25
-
26
-
27
-
28
-
29
-
30
-
31
-
32
-
33
-
34
-
35
-
36
-
37
-
38
-
39
-
40
-
41
-
42
-
43
-
44
-
45
-
46
-
47
-
48
-
49
-
50
-
51
-
52
-
53
-
54
-
55
-
56
-
57
-
58
-
59
-
60
-
61
-
62
-
63
-
64
-
65
-
66
-
67
-
68
-
69
-
70
-
71
-
72
-
73
-
74
-
75
-
76
-
77
-
 78
78 -
 79
79 -
 80
80 -
 81
81 -
 82
82 -
 83
83 -
 84
84 -
 85
85 -
 86
86 -
 87
87 -
 88
88 -
 89
89 -
 90
90 -
 91
91 -
 92
92 -
 93
93 -
 94
94 -
 95
95 -
 96
96 -
 97
97 -
 98
98 -
99
-
100
-
101
-
102
-
103
-
104
-
105
-
106
-
107
-
108
-
109
-
110
-
111
-
112
-
113
-
114
-
115
-
116
-
117
-
118
-
119
-
120
-
121
-
122
-
123
-
124
-
125
-
126
-
127
-
128
-
129
-
130
-
131
-
132
-
133
-
134
-
135
-
136
-
137
-
138
-
139
-
140
-
141
-
142
-
143
-
144
-
145
-
146
-
147
-
148
-
149
-
150
-
151
-
152
-
153
-
154
-
155
-
156
-
157
-
158
-
159
-
160
-
161
-
162
-
163
-
164
-
165
-
166
-
167
-
168
-
169
-
170
-
171
-
172
-
173
-
174
-
175
-
176
-
177
-
178
-
179
-
180
-
181
-
182
-
183
-
184
-
185
-
186
-
187
-
188
-
189
-
190
-
191
-
192
-
193
-
194
-
195
-
196
-
197
-
198
-
199
-
200
-
201
-
202
-
203
-
204
-
205
-
206
-
207
-
208
-
209
-
210
-
211
-
212
-
213
-
214
-
215
-
216
-
217
-
218
-
219
-
220
-
221
-
222
-
223
-
224
-
225
-
226
-
227
-
228
-
229
-
230
-
231
-
232
-
233
-
234
-
235
-
236
-
237
-
238
-
239
-
240
-
241
-
242
-
243
-
244
-
245
-
246
-
247
-
248
-
249
-
250
-
251
-
252
-
253
-
254
-
255
-
256
-
257
-
258
-
259
-
260
-
261
-
262
-
263
-
264
-
265
-
266
-
267
-
268
-
269
-
270
-
271
-
272
-
273
-
274
-
275
-
276
-
277
-
278
-
279
-
280
-
281
-
282
-
283
-
284
-
285
-
286
-
287
-
288
-
289
-
290
-
291
-
292
-
293
-
294
-
295
-
296
-
297
-
298
-
299
-
300
-
301
-
302
-
303
-
304
-
305
-
306
-
307
-
308
-
309
-
310
-
311
-
312
-
313
-
314
-
315
-
316
-
317
-
318
-
319
-
320
-
321
-
322
-
323
-
324
-
325
-
326
-
327
-
328
-
329
-
330
-
331
-
332
 |
 |

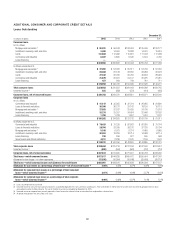
70
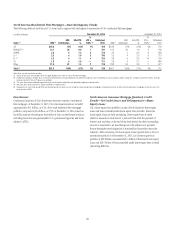
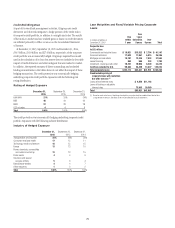
North America Residential First Mortgages—State Delinquency Trends
The following tables set forth the six U.S. states and/or regions with the highest concentration of Citi’s residential first mortgages.
In billions of dollars December 31, 2015 December 31, 2014
State (1) ENR (2)
ENR
Distribution
90+DPD
%
%
LTV >
100% (3)
Refreshed
FICO ENR (2)
ENR
Distribution
90+DPD
%
%
LTV >
100% (3)
Refreshed
FICO
CA $19.2 37% 0.2% 1% 754 $18.9 31% 0.6% 2% 745
NY/NJ/CT (4) 12.7 25 0.8 1 751 12.2 20 1.9 2 740
VA/MD 2.2 4 1.2 2 719 3.0 5 3.0 8 695
IL (4) 2.2 4 1.0 3 735 2.5 4 2.5 9 713
FL (4) 2.2 4 1.1 4 723 2.8 5 3.0 14 700
TX 1.9 4 1.0 — 711 2.5 4 2.7 — 680
Other 11.0 21 1.3 2 710 18.2 30 3.3 7 677
Total (5) $51.5 100% 0.7% 1% 738 $60.1 100% 2.1% 4% 715
Note: Totals may not sum due to rounding.
(1) Certain of the states are included as part of a region based on Citi’s view of similar HPI within the region.
(2) Ending net receivables. Excludes loans in Canada and Puerto Rico, loans guaranteed by U.S. government agencies, loans recorded at fair value and loans subject to long term standby commitments (LTSCs). Excludes
balances for which FICO or LTV data are unavailable.
(3) LTV ratios (loan balance divided by appraised value) are calculated at origination and updated by applying market price data.
(4) New York, New Jersey, Connecticut, Florida and Illinois are judicial states.
(5) Improvement in state trends during 2015 was primarily due to the sale or transfer to held-for-sale of residential first mortgages, including the transfer of CitiFinancial residential first mortgages to held-for-sale in the
fourth quarter of 2015.
Foreclosures
A substantial majority of Citi’s foreclosure inventory consists of residential
first mortgages. At December 31, 2015, Citi’s foreclosure inventory included
approximately $0.1 billion, or 0.2%, of the total residential first mortgage
portfolio, compared to $0.6 billion, or 0.9%, at December 31, 2014, based on
the dollar amount of ending net receivables of loans in foreclosure inventory,
excluding loans that are guaranteed by U.S. government agencies and loans
subject to LTSCs.
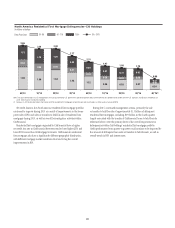
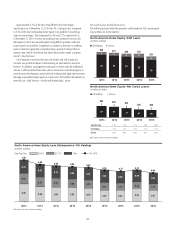
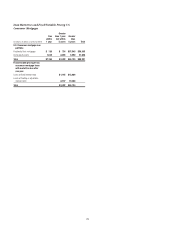
North America Consumer Mortgage Quarterly Credit
Trends—Net Credit Losses and Delinquencies—Home
Equity Loans
Citi’s home equity loan portfolio consists of both fixed-rate home equity
loans and loans extended under home equity lines of credit. Fixed-rate
home equity loans are fully amortizing. Home equity lines of credit
allow for amounts to be drawn for a period of time with the payment of
interest only and then, at the end of the draw period, the then-outstanding
amount is converted to an amortizing loan (the interest-only payment
feature during the revolving period is standard for this product across the
industry). After conversion, the home equity loans typically have a 20-year
amortization period. As of December 31, 2015, Citi’s home equity loan
portfolio of $22.8 billion consisted of $6.3 billion of fixed-rate home equity
loans and $16.5 billion of loans extended under home equity lines of credit
(Revolving HELOCs).