Citibank 2015 Annual Report Download - page 174
Download and view the complete annual report
Please find page 174 of the 2015 Citibank annual report below. You can navigate through the pages in the report by either clicking on the pages listed below, or by using the keyword search tool below to find specific information within the annual report.-
 1
1 -
2
-
3
-
4
-
5
-
6
-
7
-
8
-
9
-
10
-
11
-
12
-
13
-
14
-
15
-
16
-
17
-
18
-
19
-
20
-
21
-
22
-
23
-
24
-
25
-
26
-
27
-
28
-
29
-
30
-
31
-
32
-
33
-
34
-
35
-
36
-
37
-
38
-
39
-
40
-
41
-
42
-
43
-
44
-
45
-
46
-
47
-
48
-
49
-
50
-
51
-
52
-
53
-
54
-
55
-
56
-
57
-
58
-
59
-
60
-
61
-
62
-
63
-
64
-
65
-
66
-
67
-
68
-
69
-
70
-
71
-
72
-
73
-
74
-
75
-
76
-
77
-
78
-
79
-
80
-
81
-
82
-
83
-
84
-
85
-
86
-
87
-
88
-
89
-
90
-
91
-
92
-
93
-
94
-
95
-
96
-
97
-
98
-
99
-
100
-
101
-
102
-
103
-
104
-
105
-
106
-
107
-
108
-
109
-
110
-
111
-
112
-
113
-
114
-
115
-
116
-
117
-
118
-
119
-
120
-
121
-
122
-
123
-
124
-
125
-
126
-
127
-
128
-
129
-
130
-
131
-
132
-
133
-
134
-
135
-
136
-
137
-
138
-
139
-
140
-
141
-
142
-
143
-
144
-
145
-
146
-
147
-
148
-
149
-
150
-
151
-
152
-
153
-
154
-
155
-
156
-
157
-
158
-
159
-
160
-
161
-
162
-
163
-
 164
164 -
 165
165 -
 166
166 -
 167
167 -
 168
168 -
 169
169 -
 170
170 -
 171
171 -
 172
172 -
 173
173 -
 174
174 -
 175
175 -
 176
176 -
 177
177 -
 178
178 -
 179
179 -
 180
180 -
 181
181 -
 182
182 -
 183
183 -
 184
184 -
185
-
186
-
187
-
188
-
189
-
190
-
191
-
192
-
193
-
194
-
195
-
196
-
197
-
198
-
199
-
200
-
201
-
202
-
203
-
204
-
205
-
206
-
207
-
208
-
209
-
210
-
211
-
212
-
213
-
214
-
215
-
216
-
217
-
218
-
219
-
220
-
221
-
222
-
223
-
224
-
225
-
226
-
227
-
228
-
229
-
230
-
231
-
232
-
233
-
234
-
235
-
236
-
237
-
238
-
239
-
240
-
241
-
242
-
243
-
244
-
245
-
246
-
247
-
248
-
249
-
250
-
251
-
252
-
253
-
254
-
255
-
256
-
257
-
258
-
259
-
260
-
261
-
262
-
263
-
264
-
265
-
266
-
267
-
268
-
269
-
270
-
271
-
272
-
273
-
274
-
275
-
276
-
277
-
278
-
279
-
280
-
281
-
282
-
283
-
284
-
285
-
286
-
287
-
288
-
289
-
290
-
291
-
292
-
293
-
294
-
295
-
296
-
297
-
298
-
299
-
300
-
301
-
302
-
303
-
304
-
305
-
306
-
307
-
308
-
309
-
310
-
311
-
312
-
313
-
314
-
315
-
316
-
317
-
318
-
319
-
320
-
321
-
322
-
323
-
324
-
325
-
326
-
327
-
328
-
329
-
330
-
331
-
332
 |
 |

156
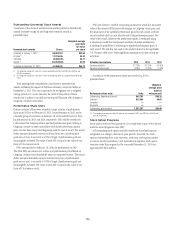
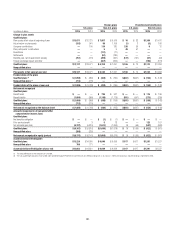
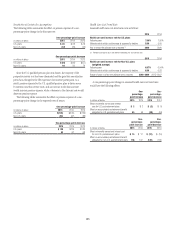
Outstanding (Unvested) Stock Awards
A summary of the status of unvested stock awards granted as discretionary
annual incentive or sign-on and long-term retention awards is
presented below:
Unvested stock awards Shares
Weighted-average
grant date
fair value
per share
Unvested at January 1, 2015 50,004,393 $42.52
Granted (1) 17,815,456 50.33
Canceled (2,005,875) 44.71
Vested (2) (23,953,683) 42.53
Unvested at December 31, 2015 41,860,291 $45.73
(1) The weighted-average fair value of the shares granted during 2014 and 2013 was $49.65 and
$43.96, respectively.
(2) The weighted-average fair value of the shares vesting during 2015 was approximately $48.09 per
share.
Total unrecognized compensation cost related to unvested stock
awards, excluding the impact of forfeiture estimates, was $634 million at
December 31, 2015. The cost is expected to be recognized over a weighted-
average period of 1.5 years. However, the value of the portion of these
awards that is subject to variable accounting will fluctuate with changes in
Citigroup’s common stock price.
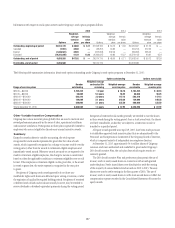
Performance Share Units
Certain executive officers were awarded a target number of performance
share units (PSUs) on February 19, 2013, for performance in 2012, and to
a broader group of executives on February 18, 2014 and February 18, 2015,
for performance in 2013 and 2014, respectively. PSUs will be earned only
to the extent that Citigroup attains specified performance goals relating to
Citigroup’s return on assets and relative total shareholder return against
peers over the three-year period beginning with the year of award. The actual
dollar amounts ultimately earned could vary from zero, if performance
goals are not met, to as much as 150% of target, if performance goals are
meaningfully exceeded. The value of each PSU is equal to the value of one
share of Citi common stock.
PSUs were granted on February 16, 2016, for performance in 2015.
The 2016 PSUs are earned over a three-year performance period based on
Citigroup’s relative total shareholder return as compared to peers. The actual
dollar amounts ultimately earned could vary from zero, if performance
goals are not met, to as much as 150% of target, if performance goals are
meaningfully exceeded. The value of each PSU is equal to the value of one
share of Citi common stock.
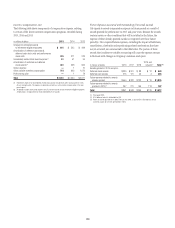
PSUs are subject to variable accounting, pursuant to which the associated
value of the award will fluctuate with changes in Citigroup’s stock price and
the attainment of the specified performance goals for each award, until the
award is settled solely in cash after the end of the performance period. The
value of the award, subject to the performance goals, is estimated using
a simulation model that incorporates multiple valuation assumptions,
including the probability of achieving the specified performance goals of
each award. The risk-free rate used in the model is based on the applicable
U.S. Treasury yield curve. Other significant assumptions for the awards are
as follows:
Valuation assumptions 2015 2014 2013
Expected volatility 27.13% 39.12% 42.65%
Expected dividend yield 0.08% 0.08% 0.12%
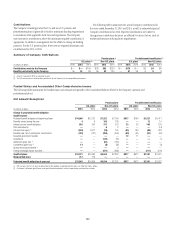
A summary of the performance share unit activity for 2015 is
presented below:
Performance share units Units
Weighted-
average grant
date fair
value per unit
Outstanding, beginning of period 843,793 $46.28
Granted (1) 513,464 44.07
Canceled — —
Payments — —
Outstanding, end of period 1,357,257 $45.45
(1) The weighted-average grant date fair value per unit awarded in 2014 and 2013 was $48.34 and
$42.26, respectively.
Stock Option Programs
Stock options have not been granted to Citi’s employees as part of the annual
incentive award programs since 2009.
All outstanding stock options are fully vested with the related expense
recognized as a charge to income in prior periods. Generally, the stock
options outstanding have a six-year term, with some stock options subject
to various transfer restrictions. Cash received from employee stock option
exercises under this program for the year ended December 31, 2015 was
approximately $634 million.