Citibank 2015 Annual Report Download - page 87
Download and view the complete annual report
Please find page 87 of the 2015 Citibank annual report below. You can navigate through the pages in the report by either clicking on the pages listed below, or by using the keyword search tool below to find specific information within the annual report.-
 1
1 -
2
-
3
-
4
-
5
-
6
-
7
-
8
-
9
-
10
-
11
-
12
-
13
-
14
-
15
-
16
-
17
-
18
-
19
-
20
-
21
-
22
-
23
-
24
-
25
-
26
-
27
-
28
-
29
-
30
-
31
-
32
-
33
-
34
-
35
-
36
-
37
-
38
-
39
-
40
-
41
-
42
-
43
-
44
-
45
-
46
-
47
-
48
-
49
-
50
-
51
-
52
-
53
-
54
-
55
-
56
-
57
-
58
-
59
-
60
-
61
-
62
-
63
-
64
-
65
-
66
-
67
-
68
-
69
-
70
-
71
-
72
-
73
-
74
-
75
-
76
-
 77
77 -
 78
78 -
 79
79 -
 80
80 -
 81
81 -
 82
82 -
 83
83 -
 84
84 -
 85
85 -
 86
86 -
 87
87 -
 88
88 -
 89
89 -
 90
90 -
 91
91 -
 92
92 -
 93
93 -
 94
94 -
 95
95 -
 96
96 -
 97
97 -
98
-
99
-
100
-
101
-
102
-
103
-
104
-
105
-
106
-
107
-
108
-
109
-
110
-
111
-
112
-
113
-
114
-
115
-
116
-
117
-
118
-
119
-
120
-
121
-
122
-
123
-
124
-
125
-
126
-
127
-
128
-
129
-
130
-
131
-
132
-
133
-
134
-
135
-
136
-
137
-
138
-
139
-
140
-
141
-
142
-
143
-
144
-
145
-
146
-
147
-
148
-
149
-
150
-
151
-
152
-
153
-
154
-
155
-
156
-
157
-
158
-
159
-
160
-
161
-
162
-
163
-
164
-
165
-
166
-
167
-
168
-
169
-
170
-
171
-
172
-
173
-
174
-
175
-
176
-
177
-
178
-
179
-
180
-
181
-
182
-
183
-
184
-
185
-
186
-
187
-
188
-
189
-
190
-
191
-
192
-
193
-
194
-
195
-
196
-
197
-
198
-
199
-
200
-
201
-
202
-
203
-
204
-
205
-
206
-
207
-
208
-
209
-
210
-
211
-
212
-
213
-
214
-
215
-
216
-
217
-
218
-
219
-
220
-
221
-
222
-
223
-
224
-
225
-
226
-
227
-
228
-
229
-
230
-
231
-
232
-
233
-
234
-
235
-
236
-
237
-
238
-
239
-
240
-
241
-
242
-
243
-
244
-
245
-
246
-
247
-
248
-
249
-
250
-
251
-
252
-
253
-
254
-
255
-
256
-
257
-
258
-
259
-
260
-
261
-
262
-
263
-
264
-
265
-
266
-
267
-
268
-
269
-
270
-
271
-
272
-
273
-
274
-
275
-
276
-
277
-
278
-
279
-
280
-
281
-
282
-
283
-
284
-
285
-
286
-
287
-
288
-
289
-
290
-
291
-
292
-
293
-
294
-
295
-
296
-
297
-
298
-
299
-
300
-
301
-
302
-
303
-
304
-
305
-
306
-
307
-
308
-
309
-
310
-
311
-
312
-
313
-
314
-
315
-
316
-
317
-
318
-
319
-
320
-
321
-
322
-
323
-
324
-
325
-
326
-
327
-
328
-
329
-
330
-
331
-
332
 |
 |
69
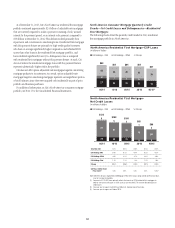
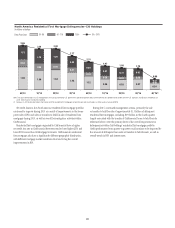
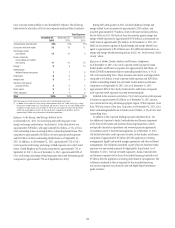
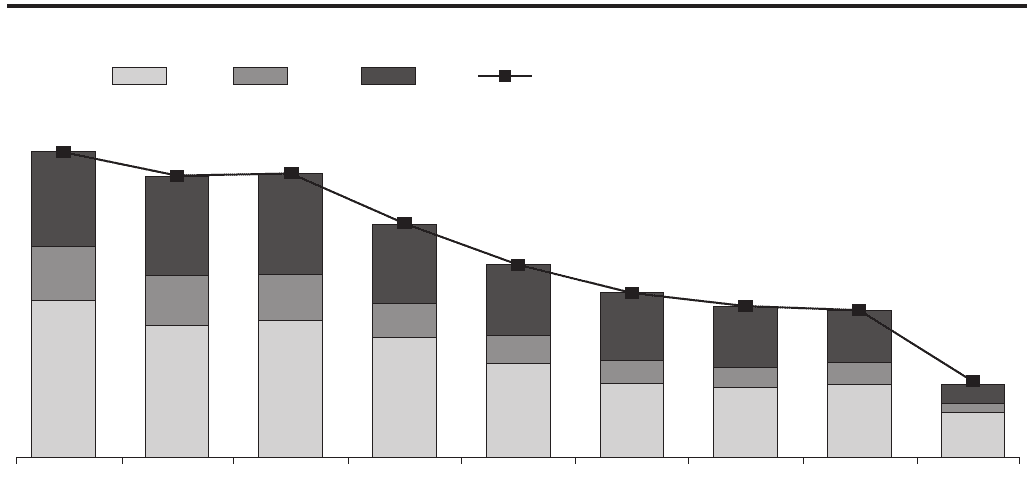
North America Residential First Mortgage Delinquencies—Citi Holdings
In billions of dollars
Days Past Due: 30+ DPD
180+
90-179
30-89
4Q’15
(1)
3Q’152Q’151Q’154Q’143Q’142Q’141Q’144Q’13
1.88 1.58 1.64 1.43 1.12 0.88 0.83 0.87 0.54
0.64
0.59 0.55
0.41
0.34
0.28 0.25 0.26
3.66
3.34 3.39
2.77
2.31
1.97 1.80 1.75
0.86
0.10
1.13
1.18 1.20
0.94
0.84
0.81 0.72 0.62
0.23
Note: Days past due excludes (i) U.S. mortgage loans that are guaranteed by U.S. government-sponsored agencies because the potential loss predominantly resides with the U.S. agencies, and (ii) loans recorded at fair
value. Totals may not sum due to rounding.
(1) Decrease in 4Q’15 primarily reflects the transfer of CFNA residential first mortgages to held-for-sale and classification as Other assets at year-end 2015.
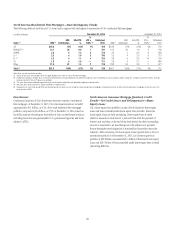
Net credit losses in the North America residential first mortgage portfolio
continued to improve during 2015 as a result of improvements in the home
price index (HPI) and sales or transfers to held-for-sale of residential first
mortgages during 2015, as well as overall loss mitigation activities within
CitiFinancial.
Residential first mortgages originated by CitiFinancial have a higher
net credit loss rate as CitiFinancial borrowers tend to have higher LTVs and
lower FICO scores than CitiMortgage borrowers. CitiFinancial’s residential
first mortgages also have a significantly different geographic distribution,
with different mortgage market conditions that tend to lag the overall
improvements in HPI.
During 2015, continued management actions, primarily the sale
or transfer to held-for-sale of approximately $1.5 billion of delinquent
residential first mortgages, including $0.9 billion in the fourth quarter
largely associated with the transfer of CitiFinancial loans to held-for-sale
referenced above, were the primary driver of the overall improvement in
delinquencies within Citi Holdings’ residential first mortgage portfolio.
Credit performance from quarter to quarter could continue to be impacted by
the amount of delinquent loan sales or transfers to held-for-sale, as well as
overall trends in HPI and interest rates.