Citibank 2015 Annual Report Download - page 273
Download and view the complete annual report
Please find page 273 of the 2015 Citibank annual report below. You can navigate through the pages in the report by either clicking on the pages listed below, or by using the keyword search tool below to find specific information within the annual report.-
 1
1 -
2
-
3
-
4
-
5
-
6
-
7
-
8
-
9
-
10
-
11
-
12
-
13
-
14
-
15
-
16
-
17
-
18
-
19
-
20
-
21
-
22
-
23
-
24
-
25
-
26
-
27
-
28
-
29
-
30
-
31
-
32
-
33
-
34
-
35
-
36
-
37
-
38
-
39
-
40
-
41
-
42
-
43
-
44
-
45
-
46
-
47
-
48
-
49
-
50
-
51
-
52
-
53
-
54
-
55
-
56
-
57
-
58
-
59
-
60
-
61
-
62
-
63
-
64
-
65
-
66
-
67
-
68
-
69
-
70
-
71
-
72
-
73
-
74
-
75
-
76
-
77
-
78
-
79
-
80
-
81
-
82
-
83
-
84
-
85
-
86
-
87
-
88
-
89
-
90
-
91
-
92
-
93
-
94
-
95
-
96
-
97
-
98
-
99
-
100
-
101
-
102
-
103
-
104
-
105
-
106
-
107
-
108
-
109
-
110
-
111
-
112
-
113
-
114
-
115
-
116
-
117
-
118
-
119
-
120
-
121
-
122
-
123
-
124
-
125
-
126
-
127
-
128
-
129
-
130
-
131
-
132
-
133
-
134
-
135
-
136
-
137
-
138
-
139
-
140
-
141
-
142
-
143
-
144
-
145
-
146
-
147
-
148
-
149
-
150
-
151
-
152
-
153
-
154
-
155
-
156
-
157
-
158
-
159
-
160
-
161
-
162
-
163
-
164
-
165
-
166
-
167
-
168
-
169
-
170
-
171
-
172
-
173
-
174
-
175
-
176
-
177
-
178
-
179
-
180
-
181
-
182
-
183
-
184
-
185
-
186
-
187
-
188
-
189
-
190
-
191
-
192
-
193
-
194
-
195
-
196
-
197
-
198
-
199
-
200
-
201
-
202
-
203
-
204
-
205
-
206
-
207
-
208
-
209
-
210
-
211
-
212
-
213
-
214
-
215
-
216
-
217
-
218
-
219
-
220
-
221
-
222
-
223
-
224
-
225
-
226
-
227
-
228
-
229
-
230
-
231
-
232
-
233
-
234
-
235
-
236
-
237
-
238
-
239
-
240
-
241
-
242
-
243
-
244
-
245
-
246
-
247
-
248
-
249
-
250
-
251
-
252
-
253
-
254
-
255
-
256
-
257
-
258
-
259
-
260
-
261
-
262
-
 263
263 -
 264
264 -
 265
265 -
 266
266 -
 267
267 -
 268
268 -
 269
269 -
 270
270 -
 271
271 -
 272
272 -
 273
273 -
 274
274 -
 275
275 -
 276
276 -
 277
277 -
 278
278 -
 279
279 -
 280
280 -
 281
281 -
 282
282 -
 283
283 -
284
-
285
-
286
-
287
-
288
-
289
-
290
-
291
-
292
-
293
-
294
-
295
-
296
-
297
-
298
-
299
-
300
-
301
-
302
-
303
-
304
-
305
-
306
-
307
-
308
-
309
-
310
-
311
-
312
-
313
-
314
-
315
-
316
-
317
-
318
-
319
-
320
-
321
-
322
-
323
-
324
-
325
-
326
-
327
-
328
-
329
-
330
-
331
-
332
 |
 |

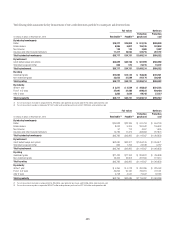
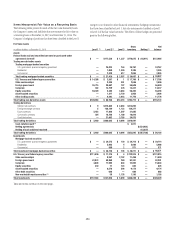
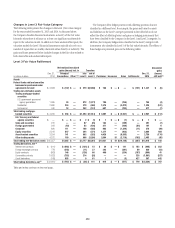
255
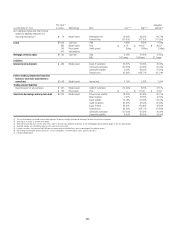
In millions of dollars at December 31, 2015 Level 1 (1) Level 2 (1) Level 3
Gross
inventory Netting (2)
Net
balance
Loans (5) $ — $ 2,839 $ 2,166 $ 5,005 $ — $ 5,005
Mortgage servicing rights — — 1,781 1,781 — 1,781
Non-trading derivatives and other financial assets measured
on a recurring basis, gross $ — $ 7,882 $ 180 $ 8,062
Cash collateral paid (6) 8
Netting of cash collateral received $ (1,949)
Non-trading derivatives and other financial assets measured
on a recurring basis $ — $ 7,882 $ 180 $ 8,070 $ (1,949) $ 6,121
Total assets $260,938 $1,013,230 $ 32,637 $1,311,724 $(610,568) $701,156
Total as a percentage of gross assets (7) 20.0% 77.5% 2.5%
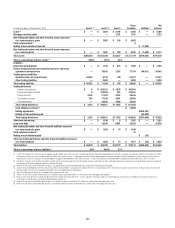
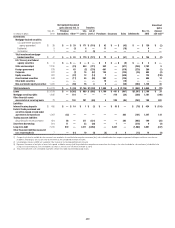
Liabilities
Interest-bearing deposits $ — $ 1,156 $ 434 $ 1,590 $ — $ 1,590
Federal funds purchased and securities loaned or sold under
agreements to repurchase — 76,507 1,247 77,754 (40,911) 36,843
Trading account liabilities
Securities sold, not yet purchased 48,452 9,176 199 57,827 — 57,827
Other trading liabilities — 2,093 — 2,093 — 2,093
Total trading liabilities $ 48,452 $ 11,269 $ 199 $ 59,920 $ — $ 59,920
Trading derivatives
Interest rate contracts $ 5 $ 393,321 $ 2,578 $ 395,904
Foreign exchange contracts 6 133,404 503 133,913
Equity contracts 2,244 21,875 2,397 26,516
Commodity contracts 263 17,329 2,961 20,553
Credit derivatives — 30,682 3,486 34,168
Total trading derivatives $ 2,518 $ 596,611 $ 11,925 $ 611,054
Cash collateral received (8) $ 13,628
Netting agreements $(524,481)
Netting of cash collateral paid (42,609)
Total trading derivatives $ 2,518 $ 596,611 $ 11,925 $ 624,682 $(567,090) $ 57,592
Short-term borrowings $ — $ 1,198 $ 9 $ 1,207 $ — $ 1,207
Long-term debt — 18,342 6,951 25,293 — 25,293
Non-trading derivatives and other financial liabilities measured
on a recurring basis, gross $ — $ 1,626 $ 14 $ 1,640
Cash collateral received (9) 37
Netting of cash collateral paid $ (53)
Total non-trading derivatives and other financial liabilities measured
on a recurring basis $ — $ 1,626 $ 14 $ 1,677 $ (53) $ 1,624
Total liabilities $ 50,970 $ 706,709 $ 20,779 $ 792,123 $(608,054) $184,069
Total as a percentage of gross liabilities (7) 6.5% 90.8% 2.7%
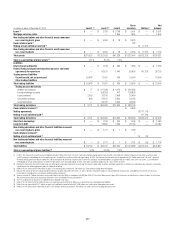
(1) In 2015, the Company transferred assets of approximately $3.3 billion from Level 1 to Level 2, respectively, primarily related to foreign government securities and equity securities not traded in active markets. In 2015,
the Company transferred assets of approximately $4.4 billion from Level 2 to Level 1, respectively, primarily related to foreign government bonds and equity securities traded with sufficient frequency to constitute a
liquid market. In 2015, the Company transferred liabilities of approximately $0.6 billion from Level 2 to Level 1. In 2015, the Company transferred liabilities of approximately $0.4 billion from Level 1 to Level 2.
(2) Represents netting of: (i) the amounts due under securities purchased under agreements to resell and the amounts owed under securities sold under agreements to repurchase; and (ii) derivative exposures covered by
a qualifying master netting agreement and cash collateral offsetting.
(3) Reflects the net amount of $47,520 million of gross cash collateral paid, of which $42,609 million was used to offset trading derivative liabilities.
(4) Amounts exclude $0.9 billion investments measured at Net Asset Value (NAV) in accordance with ASU No. 2015-07, Fair Value Measurement (Topic 820): Disclosures for Investments in Certain Entities That Calculate
Net Asset Value per Share (or Its Equivalent). See Note 1 to the Consolidated Financial Statements.
(5) There is no allowance for loan losses recorded for loans reported at fair value.
(6) Reflects the net amount of $61 million of gross cash collateral paid, of which $53 million was used to offset non-trading derivative liabilities.
(7) Because the amount of the cash collateral paid/received has not been allocated to the Level 1, 2 and 3 subtotals, these percentages are calculated based on total assets and liabilities measured at fair value on a
recurring basis, excluding the cash collateral paid/received on derivatives.
(8) Reflects the net amount of $56,855 million of gross cash collateral received, of which $43,227 million was used to offset trading derivative assets.
(9) Reflects the net amount of $1,986 million of gross cash collateral received, of which $1,949 million was used to offset non-trading derivative assets.