Citibank 2015 Annual Report Download - page 260
Download and view the complete annual report
Please find page 260 of the 2015 Citibank annual report below. You can navigate through the pages in the report by either clicking on the pages listed below, or by using the keyword search tool below to find specific information within the annual report.-
 1
1 -
2
-
3
-
4
-
5
-
6
-
7
-
8
-
9
-
10
-
11
-
12
-
13
-
14
-
15
-
16
-
17
-
18
-
19
-
20
-
21
-
22
-
23
-
24
-
25
-
26
-
27
-
28
-
29
-
30
-
31
-
32
-
33
-
34
-
35
-
36
-
37
-
38
-
39
-
40
-
41
-
42
-
43
-
44
-
45
-
46
-
47
-
48
-
49
-
50
-
51
-
52
-
53
-
54
-
55
-
56
-
57
-
58
-
59
-
60
-
61
-
62
-
63
-
64
-
65
-
66
-
67
-
68
-
69
-
70
-
71
-
72
-
73
-
74
-
75
-
76
-
77
-
78
-
79
-
80
-
81
-
82
-
83
-
84
-
85
-
86
-
87
-
88
-
89
-
90
-
91
-
92
-
93
-
94
-
95
-
96
-
97
-
98
-
99
-
100
-
101
-
102
-
103
-
104
-
105
-
106
-
107
-
108
-
109
-
110
-
111
-
112
-
113
-
114
-
115
-
116
-
117
-
118
-
119
-
120
-
121
-
122
-
123
-
124
-
125
-
126
-
127
-
128
-
129
-
130
-
131
-
132
-
133
-
134
-
135
-
136
-
137
-
138
-
139
-
140
-
141
-
142
-
143
-
144
-
145
-
146
-
147
-
148
-
149
-
150
-
151
-
152
-
153
-
154
-
155
-
156
-
157
-
158
-
159
-
160
-
161
-
162
-
163
-
164
-
165
-
166
-
167
-
168
-
169
-
170
-
171
-
172
-
173
-
174
-
175
-
176
-
177
-
178
-
179
-
180
-
181
-
182
-
183
-
184
-
185
-
186
-
187
-
188
-
189
-
190
-
191
-
192
-
193
-
194
-
195
-
196
-
197
-
198
-
199
-
200
-
201
-
202
-
203
-
204
-
205
-
206
-
207
-
208
-
209
-
210
-
211
-
212
-
213
-
214
-
215
-
216
-
217
-
218
-
219
-
220
-
221
-
222
-
223
-
224
-
225
-
226
-
227
-
228
-
229
-
230
-
231
-
232
-
233
-
234
-
235
-
236
-
237
-
238
-
239
-
240
-
241
-
242
-
243
-
244
-
245
-
246
-
247
-
248
-
249
-
 250
250 -
 251
251 -
 252
252 -
 253
253 -
 254
254 -
 255
255 -
 256
256 -
 257
257 -
 258
258 -
 259
259 -
 260
260 -
 261
261 -
 262
262 -
 263
263 -
 264
264 -
 265
265 -
 266
266 -
 267
267 -
 268
268 -
 269
269 -
 270
270 -
271
-
272
-
273
-
274
-
275
-
276
-
277
-
278
-
279
-
280
-
281
-
282
-
283
-
284
-
285
-
286
-
287
-
288
-
289
-
290
-
291
-
292
-
293
-
294
-
295
-
296
-
297
-
298
-
299
-
300
-
301
-
302
-
303
-
304
-
305
-
306
-
307
-
308
-
309
-
310
-
311
-
312
-
313
-
314
-
315
-
316
-
317
-
318
-
319
-
320
-
321
-
322
-
323
-
324
-
325
-
326
-
327
-
328
-
329
-
330
-
331
-
332
 |
 |

242
Hedging of Foreign Exchange Risk
Citigroup hedges the change in fair value attributable to foreign-exchange
rate movements in available-for-sale securities that are denominated in
currencies other than the functional currency of the entity holding the
securities, which may be within or outside the U.S. The hedging instrument
employed is generally a forward foreign-exchange contract. In this hedge,
the change in fair value of the hedged available-for-sale security attributable
to the portion of foreign exchange risk hedged is reported in earnings, and
not Accumulated other comprehensive income (loss)—which serves to
offset the change in fair value of the forward contract that is also reflected in
earnings. Citigroup considers the premium associated with forward contracts
(i.e., the differential between spot and contractual forward rates) as the
cost of hedging; this is excluded from the assessment of hedge effectiveness
and reflected directly in earnings. The dollar-offset method is used to assess
hedge effectiveness. Since that assessment is based on changes in fair value
attributable to changes in spot rates on both the available-for-sale securities
and the forward contracts for the portion of the relationship hedged, the
amount of hedge ineffectiveness is not significant.
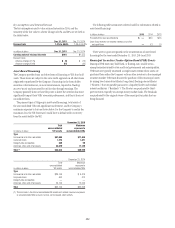
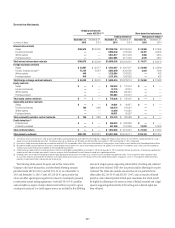
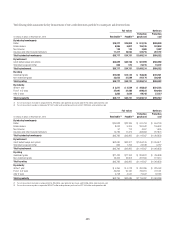
The following table summarizes the gains (losses) on the Company’s fair value hedges:
Gains (losses) on fair value hedges (1)
Year ended December 31,
In millions of dollars 2015 2014 2013
Gain (loss) on the derivatives in designated and qualifying fair value hedges
Interest rate contracts $ (847) $ 1,546 $ (3,288)
Foreign exchange contracts 1,315 1,367 265
Commodity contracts 41 (221) —
Total gain (loss) on the derivatives in designated and qualifying fair value hedges $ 509 $ 2,692 $(3,023)
Gain (loss) on the hedged item in designated and qualifying fair value hedges
Interest rate hedges $ 792 $(1,496) $ 3,204
Foreign exchange hedges (1,258) (1,422) (185)
Commodity hedges (35) 250 —
Total gain (loss) on the hedged item in designated and qualifying fair value hedges $ (501) $ (2,668) $ 3,019
Hedge ineffectiveness recognized in earnings on designated and qualifying fair value hedges
Interest rate hedges $ (47) $ 53 $ (84)
Foreign exchange hedges (23) (16) (4)
Total hedge ineffectiveness recognized in earnings on designated and qualifying fair value hedges $ (70) $ 37 $ (88)
Net gain (loss) excluded from assessment of the effectiveness of fair value hedges
Interest rate contracts $ (8) $ (3) $ —
Foreign exchange contracts (2) 80 (39) 84
Commodity hedges (2) 629 —
Total net gain (loss) excluded from assessment of the effectiveness of fair value hedges $ 78 $ (13) $ 84
(1) Amounts are included in Other revenue on the Consolidated Statement of Income. The accrued interest income on fair value hedges is recorded in Net interest revenue and is excluded from this table.
(2) Amounts relate to the premium associated with forward contracts (differential between spot and contractual forward rates). These amounts are excluded from the assessment of hedge effectiveness and are reflected
directly in earnings.