Citibank 2015 Annual Report Download - page 169
Download and view the complete annual report
Please find page 169 of the 2015 Citibank annual report below. You can navigate through the pages in the report by either clicking on the pages listed below, or by using the keyword search tool below to find specific information within the annual report.-
 1
1 -
2
-
3
-
4
-
5
-
6
-
7
-
8
-
9
-
10
-
11
-
12
-
13
-
14
-
15
-
16
-
17
-
18
-
19
-
20
-
21
-
22
-
23
-
24
-
25
-
26
-
27
-
28
-
29
-
30
-
31
-
32
-
33
-
34
-
35
-
36
-
37
-
38
-
39
-
40
-
41
-
42
-
43
-
44
-
45
-
46
-
47
-
48
-
49
-
50
-
51
-
52
-
53
-
54
-
55
-
56
-
57
-
58
-
59
-
60
-
61
-
62
-
63
-
64
-
65
-
66
-
67
-
68
-
69
-
70
-
71
-
72
-
73
-
74
-
75
-
76
-
77
-
78
-
79
-
80
-
81
-
82
-
83
-
84
-
85
-
86
-
87
-
88
-
89
-
90
-
91
-
92
-
93
-
94
-
95
-
96
-
97
-
98
-
99
-
100
-
101
-
102
-
103
-
104
-
105
-
106
-
107
-
108
-
109
-
110
-
111
-
112
-
113
-
114
-
115
-
116
-
117
-
118
-
119
-
120
-
121
-
122
-
123
-
124
-
125
-
126
-
127
-
128
-
129
-
130
-
131
-
132
-
133
-
134
-
135
-
136
-
137
-
138
-
139
-
140
-
141
-
142
-
143
-
144
-
145
-
146
-
147
-
148
-
149
-
150
-
151
-
152
-
153
-
154
-
155
-
156
-
157
-
158
-
 159
159 -
 160
160 -
 161
161 -
 162
162 -
 163
163 -
 164
164 -
 165
165 -
 166
166 -
 167
167 -
 168
168 -
 169
169 -
 170
170 -
 171
171 -
 172
172 -
 173
173 -
 174
174 -
 175
175 -
 176
176 -
 177
177 -
 178
178 -
 179
179 -
180
-
181
-
182
-
183
-
184
-
185
-
186
-
187
-
188
-
189
-
190
-
191
-
192
-
193
-
194
-
195
-
196
-
197
-
198
-
199
-
200
-
201
-
202
-
203
-
204
-
205
-
206
-
207
-
208
-
209
-
210
-
211
-
212
-
213
-
214
-
215
-
216
-
217
-
218
-
219
-
220
-
221
-
222
-
223
-
224
-
225
-
226
-
227
-
228
-
229
-
230
-
231
-
232
-
233
-
234
-
235
-
236
-
237
-
238
-
239
-
240
-
241
-
242
-
243
-
244
-
245
-
246
-
247
-
248
-
249
-
250
-
251
-
252
-
253
-
254
-
255
-
256
-
257
-
258
-
259
-
260
-
261
-
262
-
263
-
264
-
265
-
266
-
267
-
268
-
269
-
270
-
271
-
272
-
273
-
274
-
275
-
276
-
277
-
278
-
279
-
280
-
281
-
282
-
283
-
284
-
285
-
286
-
287
-
288
-
289
-
290
-
291
-
292
-
293
-
294
-
295
-
296
-
297
-
298
-
299
-
300
-
301
-
302
-
303
-
304
-
305
-
306
-
307
-
308
-
309
-
310
-
311
-
312
-
313
-
314
-
315
-
316
-
317
-
318
-
319
-
320
-
321
-
322
-
323
-
324
-
325
-
326
-
327
-
328
-
329
-
330
-
331
-
332
 |
 |

151
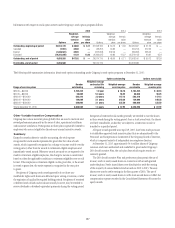
3. BUSINESS SEGMENTS
Citigroup’s activities are conducted through the GCB, ICG,
Corporate/Other and Citi Holdings business segments.
GCB includes a global, full-service consumer franchise delivering a
wide array of banking, including commercial banking, credit card lending
and investment services through a network of local branches, offices and
electronic delivery systems and is composed of four GCB businesses: North
America, EMEA, Latin America and Asia.
ICG is composed of Banking and Markets and securities services and
provides corporate, institutional, public sector and high-net-worth clients in
approximately 100 countries with a broad range of banking and financial
products and services.
Corporate/Other includes certain unallocated costs of global functions,
other corporate expenses and net treasury results, unallocated corporate
expenses, offsets to certain line-item reclassifications and eliminations, the
results of discontinued operations and unallocated taxes.
Citi Holdings is composed of businesses and portfolios of assets that
Citigroup has determined are not central to its core Citicorp businesses.
The accounting policies of these reportable segments are the same as
those disclosed in Note 1 to the Consolidated Financial Statements.
The prior-period balances reflect reclassifications to conform the
presentation for all periods to the current period’s presentation. Effective
January 1, 2015, financial data was reclassified from Citicorp to Citi Holdings
for the consumer businesses in 11 markets and the consumer finance
business in Korea in GCB and certain businesses in ICG that Citi had plans to
exit, changes in Citi’s charge-out of certain assets and non-interest revenues
from the Corporate/Other segment to Citi’s businesses, changes in charge-
outs of certain administrative, operations and technology costs among Citi’s
businesses, the re-attribution of regional results within ICG and certain other
immaterial reclassifications. Citi’s consolidated results remained unchanged
for all periods presented as a result of the changes discussed above.
In addition, as discussed in Note 1 to the Consolidated Financial
Statements, Citi adopted ASU 2014-01 in the first quarter of 2015. The ASU
is applicable to Citi’s portfolio of low income housing tax credit partnership
interests. Citi’s disclosures reflect the retrospective application of the ASU and
impacts Citi’s consolidated assets, revenues, provision for income taxes and
net income for all periods presented.
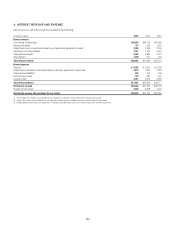
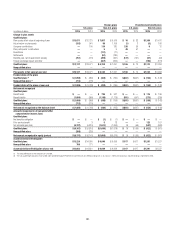
The following table presents certain information regarding the Company’s
continuing operations by segment:
Revenues,
net of interest expense (1)
Provision (benefits)
for income taxes
Income (loss) from
continuing operations (2) Identifiable assets
In millions of dollars, except
identifiable assets in billions 2015 2014 2013 2015 2014 2013 2015 2014 2013 2015 2014
Global Consumer Banking $33,862 $36,017 $36,305 $ 3,393 $3,414 $ 3,361 $ 6,382 $ 6,819 $ 6,576 $ 394 $ 406
Institutional Clients Group 33,748 33,052 33,322 4,383 4,070 4,174 9,451 9,534 9,425 1,211 1,257
Corporate/Other 907 301 322 (1,339) (344) (216) 495 (5,375) (514) 52 50
Total Citicorp $68,517 $69,370 $69,949 $ 6,437 $7,140 $ 7,319 $16,328 $10,978 $15,487 $1,657 $1,713
Citi Holdings 7,837 7,849 6,775 1,003 57 (1,133) 1,058 (3,474) (1,871) 74 129
Total $76,354 $77,219 $76,724 $ 7,440 $7,197 $ 6,186 $17,386 $ 7,504 $13,616 $1,731 $1,842
(1) Includes Citicorp (excluding Corporate/Other) total revenues, net of interest expense, in North America of $32.6 billion, $32.6 billion and $31.1 billion; in EMEA of $10.8 billion, $10.6 billion and $11.3 billion; in Latin
America of $11.2 billion, and $12.6 billion and $13.3 billion; and in Asia of $13.0 billion, $13.3 billion and $13.9 billion in 2015, 2014 and 2013, respectively.
(2) Includes pretax provisions for credit losses and for benefits and claims in the GCB results of $5.8 billion, $5.8 billion and $6.6 billion; in the ICG results of $929 million, $57 million and $78 million; and in Citi Holdings
results of $1.2 billion, $1.6 billion and $1.9 billion in 2015, 2014 and 2013, respectively.