Citibank 2015 Annual Report Download - page 151
Download and view the complete annual report
Please find page 151 of the 2015 Citibank annual report below. You can navigate through the pages in the report by either clicking on the pages listed below, or by using the keyword search tool below to find specific information within the annual report.-
 1
1 -
2
-
3
-
4
-
5
-
6
-
7
-
8
-
9
-
10
-
11
-
12
-
13
-
14
-
15
-
16
-
17
-
18
-
19
-
20
-
21
-
22
-
23
-
24
-
25
-
26
-
27
-
28
-
29
-
30
-
31
-
32
-
33
-
34
-
35
-
36
-
37
-
38
-
39
-
40
-
41
-
42
-
43
-
44
-
45
-
46
-
47
-
48
-
49
-
50
-
51
-
52
-
53
-
54
-
55
-
56
-
57
-
58
-
59
-
60
-
61
-
62
-
63
-
64
-
65
-
66
-
67
-
68
-
69
-
70
-
71
-
72
-
73
-
74
-
75
-
76
-
77
-
78
-
79
-
80
-
81
-
82
-
83
-
84
-
85
-
86
-
87
-
88
-
89
-
90
-
91
-
92
-
93
-
94
-
95
-
96
-
97
-
98
-
99
-
100
-
101
-
102
-
103
-
104
-
105
-
106
-
107
-
108
-
109
-
110
-
111
-
112
-
113
-
114
-
115
-
116
-
117
-
118
-
119
-
120
-
121
-
122
-
123
-
124
-
125
-
126
-
127
-
128
-
129
-
130
-
131
-
132
-
133
-
134
-
135
-
136
-
137
-
138
-
139
-
140
-
 141
141 -
 142
142 -
 143
143 -
 144
144 -
 145
145 -
 146
146 -
 147
147 -
 148
148 -
 149
149 -
 150
150 -
 151
151 -
 152
152 -
 153
153 -
 154
154 -
 155
155 -
 156
156 -
 157
157 -
 158
158 -
 159
159 -
 160
160 -
 161
161 -
162
-
163
-
164
-
165
-
166
-
167
-
168
-
169
-
170
-
171
-
172
-
173
-
174
-
175
-
176
-
177
-
178
-
179
-
180
-
181
-
182
-
183
-
184
-
185
-
186
-
187
-
188
-
189
-
190
-
191
-
192
-
193
-
194
-
195
-
196
-
197
-
198
-
199
-
200
-
201
-
202
-
203
-
204
-
205
-
206
-
207
-
208
-
209
-
210
-
211
-
212
-
213
-
214
-
215
-
216
-
217
-
218
-
219
-
220
-
221
-
222
-
223
-
224
-
225
-
226
-
227
-
228
-
229
-
230
-
231
-
232
-
233
-
234
-
235
-
236
-
237
-
238
-
239
-
240
-
241
-
242
-
243
-
244
-
245
-
246
-
247
-
248
-
249
-
250
-
251
-
252
-
253
-
254
-
255
-
256
-
257
-
258
-
259
-
260
-
261
-
262
-
263
-
264
-
265
-
266
-
267
-
268
-
269
-
270
-
271
-
272
-
273
-
274
-
275
-
276
-
277
-
278
-
279
-
280
-
281
-
282
-
283
-
284
-
285
-
286
-
287
-
288
-
289
-
290
-
291
-
292
-
293
-
294
-
295
-
296
-
297
-
298
-
299
-
300
-
301
-
302
-
303
-
304
-
305
-
306
-
307
-
308
-
309
-
310
-
311
-
312
-
313
-
314
-
315
-
316
-
317
-
318
-
319
-
320
-
321
-
322
-
323
-
324
-
325
-
326
-
327
-
328
-
329
-
330
-
331
-
332
 |
 |

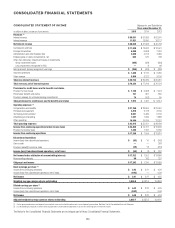
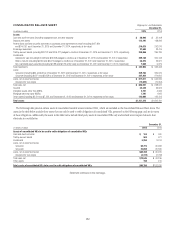
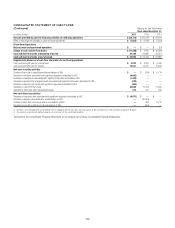
133
CONSOLIDATED BALANCE SHEET
(Continued)
Citigroup Inc. and Subsidiaries
December 31,
In millions of dollars, except shares and per share amounts 2015 2014
Liabilities
Non-interest-bearing deposits in U.S. offices $ 139,249 $ 128,958
Interest-bearing deposits in U.S. offices (including $923 and $994 as of December 31, 2015
and December 31, 2014, respectively, at fair value) 280,234 284,978
Non-interest-bearing deposits in offices outside the U.S. 71,577 70,925
Interest-bearing deposits in offices outside the U.S. (including $667 and $690 as of December 31, 2015 and
December 31, 2014, respectively, at fair value) 416,827 414,471
Total deposits $ 907,887 $ 899,332
Federal funds purchased and securities loaned or sold under agreements to repurchase
(including $36,843 and $36,725 as of December 31, 2015 and December 31, 2014, respectively, at fair value) 146,496 173,438
Brokerage payables 53,722 52,180
Trading account liabilities 117,512 139,036
Short-term borrowings (including $1,207 and $1,496 as of December 31, 2015 and December 31, 2014, respectively, at fair value) 21,079 58,335
Long-term debt (including $25,293 and $26,180 as of December 31, 2015 and December 31, 2014, respectively, at fair value) 201,275 223,080
Other liabilities (including $1,624 and $1,776 as of December 31, 2015 and December 31, 2014, respectively, at fair value) 60,147 85,084
Total liabilities $1,508,118 $1,630,485
Stockholders’ equity
Preferred stock ($1.00 par value; authorized shares: 30 million), issued shares: 668,720 as of
December 31, 2015 and 418,720 as of December 31, 2014, at aggregate liquidation value $ 16,718 $ 10,468
Common stock ($0.01 par value; authorized shares: 6 billion), issued shares: 3,099,482,042 as of
December 31, 2015 and 3,082,037,568 as of December 31, 2014 31 31
Additional paid-in capital 108,288 107,979
Retained earnings 133,841 117,852
Treasury stock, at cost: December 31, 2015—146,203,311 shares and December 31, 2014—58,119,993 shares (7,677) (2,929)
Accumulated other comprehensive income (loss) (29,344) (23,216)
Total Citigroup stockholders’ equity $ 221,857 $ 210,185
Noncontrolling interest 1,235 1,511
Total equity $ 223,092 $ 211,696
Total liabilities and equity $1,731,210 $1,842,181
The following table presents certain liabilities of consolidated VIEs, which are included in the Consolidated Balance Sheet above. The liabilities in the table
below include third-party liabilities of consolidated VIEs only and exclude intercompany balances that eliminate in consolidation. The liabilities also exclude
amounts where creditors or beneficial interest holders have recourse to the general credit of Citigroup.
December 31,
In millions of dollars 2015 2014
Liabilities of consolidated VIEs for which creditors or beneficial interest holders do not have
recourse to the general credit of Citigroup
Short-term borrowings $11,965 $20,254
Long-term debt 31,273 40,078
Other liabilities 2,099 901
Total liabilities of consolidated VIEs for which creditors or beneficial interest holders do not have
recourse to the general credit of Citigroup $45,337 $61,233
The Notes to the Consolidated Financial Statements are an integral part of these Consolidated Financial Statements.