Citibank 2015 Annual Report Download - page 206
Download and view the complete annual report
Please find page 206 of the 2015 Citibank annual report below. You can navigate through the pages in the report by either clicking on the pages listed below, or by using the keyword search tool below to find specific information within the annual report.-
 1
1 -
2
-
3
-
4
-
5
-
6
-
7
-
8
-
9
-
10
-
11
-
12
-
13
-
14
-
15
-
16
-
17
-
18
-
19
-
20
-
21
-
22
-
23
-
24
-
25
-
26
-
27
-
28
-
29
-
30
-
31
-
32
-
33
-
34
-
35
-
36
-
37
-
38
-
39
-
40
-
41
-
42
-
43
-
44
-
45
-
46
-
47
-
48
-
49
-
50
-
51
-
52
-
53
-
54
-
55
-
56
-
57
-
58
-
59
-
60
-
61
-
62
-
63
-
64
-
65
-
66
-
67
-
68
-
69
-
70
-
71
-
72
-
73
-
74
-
75
-
76
-
77
-
78
-
79
-
80
-
81
-
82
-
83
-
84
-
85
-
86
-
87
-
88
-
89
-
90
-
91
-
92
-
93
-
94
-
95
-
96
-
97
-
98
-
99
-
100
-
101
-
102
-
103
-
104
-
105
-
106
-
107
-
108
-
109
-
110
-
111
-
112
-
113
-
114
-
115
-
116
-
117
-
118
-
119
-
120
-
121
-
122
-
123
-
124
-
125
-
126
-
127
-
128
-
129
-
130
-
131
-
132
-
133
-
134
-
135
-
136
-
137
-
138
-
139
-
140
-
141
-
142
-
143
-
144
-
145
-
146
-
147
-
148
-
149
-
150
-
151
-
152
-
153
-
154
-
155
-
156
-
157
-
158
-
159
-
160
-
161
-
162
-
163
-
164
-
165
-
166
-
167
-
168
-
169
-
170
-
171
-
172
-
173
-
174
-
175
-
176
-
177
-
178
-
179
-
180
-
181
-
182
-
183
-
184
-
185
-
186
-
187
-
188
-
189
-
190
-
191
-
192
-
193
-
194
-
195
-
 196
196 -
 197
197 -
 198
198 -
 199
199 -
 200
200 -
 201
201 -
 202
202 -
 203
203 -
 204
204 -
 205
205 -
 206
206 -
 207
207 -
 208
208 -
 209
209 -
 210
210 -
 211
211 -
 212
212 -
 213
213 -
 214
214 -
 215
215 -
 216
216 -
217
-
218
-
219
-
220
-
221
-
222
-
223
-
224
-
225
-
226
-
227
-
228
-
229
-
230
-
231
-
232
-
233
-
234
-
235
-
236
-
237
-
238
-
239
-
240
-
241
-
242
-
243
-
244
-
245
-
246
-
247
-
248
-
249
-
250
-
251
-
252
-
253
-
254
-
255
-
256
-
257
-
258
-
259
-
260
-
261
-
262
-
263
-
264
-
265
-
266
-
267
-
268
-
269
-
270
-
271
-
272
-
273
-
274
-
275
-
276
-
277
-
278
-
279
-
280
-
281
-
282
-
283
-
284
-
285
-
286
-
287
-
288
-
289
-
290
-
291
-
292
-
293
-
294
-
295
-
296
-
297
-
298
-
299
-
300
-
301
-
302
-
303
-
304
-
305
-
306
-
307
-
308
-
309
-
310
-
311
-
312
-
313
-
314
-
315
-
316
-
317
-
318
-
319
-
320
-
321
-
322
-
323
-
324
-
325
-
326
-
327
-
328
-
329
-
330
-
331
-
332
 |
 |

188
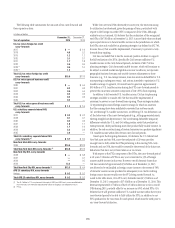
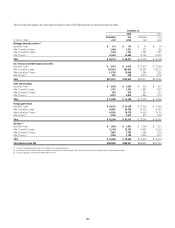
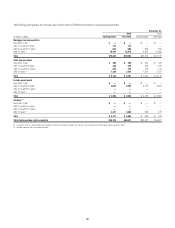
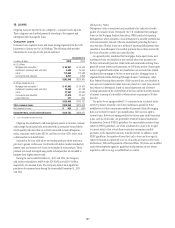
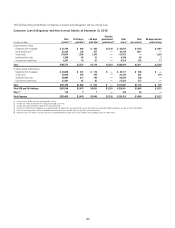
The following table presents the amortized cost and fair value of AFS debt securities by contractual maturity dates:
December 31,
2015 2014
In millions of dollars
Amortized
cost
Fair
value
Amortized
cost
Fair
value
Mortgage-backed securities (1)
Due within 1 year $ 114 $ 114 $ 44 $ 44
After 1 but within 5 years 1,408 1,411 931 935
After 5 but within 10 years 1,750 1,751 1,362 1,387
After 10 years (2) 42,846 42,995 42,163 42,642
Total $ 46,118 $ 46,271 $ 44,500 $ 45,008
U.S. Treasury and federal agency securities
Due within 1 year $ 3,016 $ 3,014 $ 13,070 $ 13,084
After 1 but within 5 years 107,034 106,878 104,982 105,131
After 5 but within 10 years 12,786 12,684 2,286 2,325
After 10 years (2) 355 339 3,079 3,150
Total $123,191 $122,915 $123,417 $123,690
State and municipal
Due within 1 year $ 3,289 $ 3,287 $ 652 $ 651
After 1 but within 5 years 1,781 1,781 4,387 4,381
After 5 but within 10 years 502 516 524 537
After 10 years (2) 6,527 5,875 7,963 7,130
Total $ 12,099 $ 11,459 $ 13,526 $ 12,699
Foreign government
Due within 1 year $ 26,322 $ 26,329 $ 31,355 $ 31,382
After 1 but within 5 years 44,801 44,756 41,913 42,467
After 5 but within 10 years 18,935 18,779 16,008 15,779
After 10 years (2) 2,326 2,337 973 1,069
Total $ 92,384 $ 92,201 $ 90,249 $ 90,697
All other (3)
Due within 1 year $ 1,930 $ 1,931 $ 1,248 $ 1,251
After 1 but within 5 years 12,748 12,762 10,442 10,535
After 5 but within 10 years 7,867 7,782 7,282 7,318
After 10 years (2) 3,263 3,190 6,256 6,220
Total $ 25,808 $ 25,665 $ 25,228 $ 25,324
Total debt securities AFS $299,600 $298,511 $296,920 $297,418
(1) Includes mortgage-backed securities of U.S. government-sponsored agencies.
(2) Investments with no stated maturities are included as contractual maturities of greater than 10 years. Actual maturities may differ due to call or prepayment rights.
(3) Includes corporate, asset-backed and other debt securities.